Flow Graph view
Overview
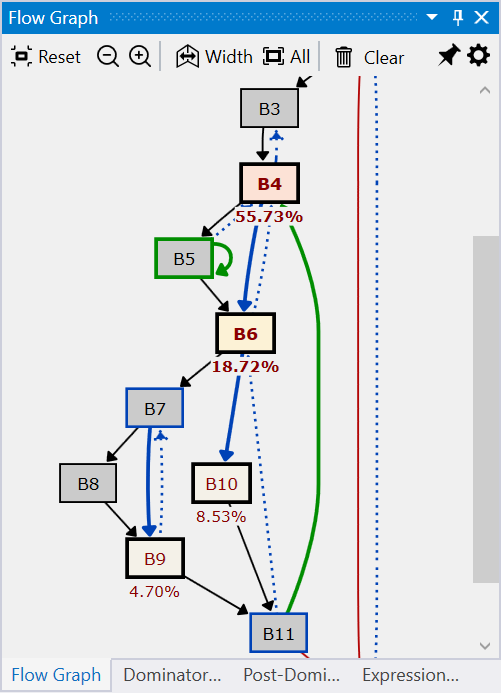
The Flow Graph view displays the control-flow graph (CFG) of the function viewed in the active Assembly view.
The function CFG makes it easier to see the structure of a function and control-flow created by jumps, branches, and loops. The slowest basic blocks are annotated with profiling information.
The view has two parts:
- a main toolbar at the top, with general action buttons.
- an interactive CFG area, supporting zooming and panning.
Each basic block is represented by a rectangle, with the block number as the label. An edge between two blocks means the source and destination block are connected either through a jump/branch or fall-through code.
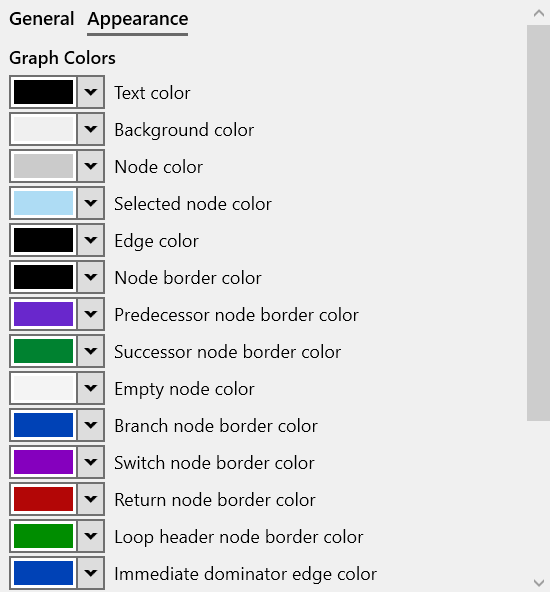
Color coding
Different colors of the blocks and edges are used to help identify control flow. The used colors can be customized in the Flow Graph options.
Block border colors coding (default colors):
- blue: blocks ends with a branch instruction.
- green: block is the target of a loop back-edge (it's a loop header).
- red: block ends with a return instruction (it's a function exit),
Edge color coding (default colors):
- blue: target block is a branch target (branch in the source block jumps to it).
- green: loop back-edge, target block is a loop header (start of a loop).
- red: target block is a function exit block.
- dotted: target block is the immediate dominator of the source block.
Selection sync
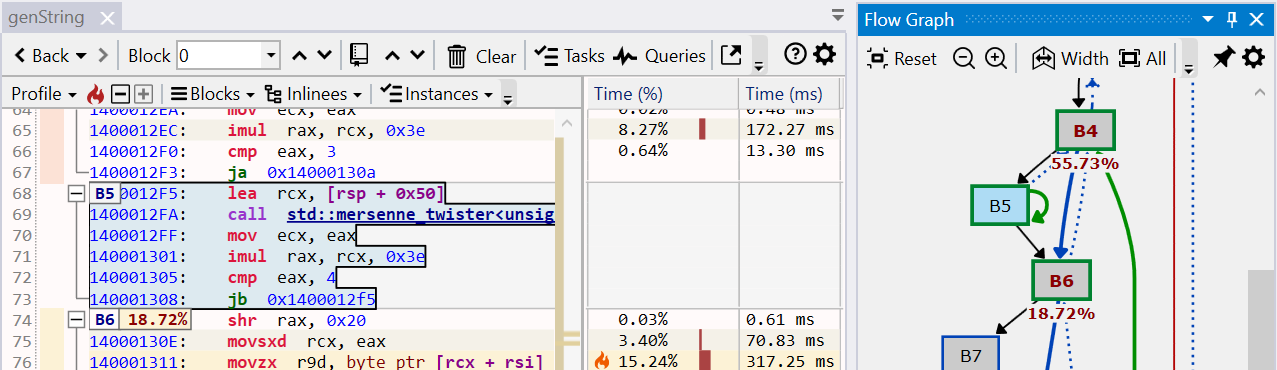
When a block is selected, the corresponding instructions are also selected in the Assembly view, like in the example below where B5 is selected. Notice that B5 is a single-block, nested loop, while B4 is the loop header block of a larger loop including B5.
Profiling annotations
Blocks with a significant execution time are marked by using bold text for the block number and changing their background color (same color coding as in the Assembly view).
A label is displayed underneath with the block's execution time percentage relative to the function's total execution time.
View interaction
Toolbar
| Button | Description |
|---|---|
 |
Resets the view to it's original state. |
 |
Zooms out the view around the center point. |
 |
Zooms in the view around the center point. |
 |
Resizes the view so that the width of the graph matches the available horizontal area. |
 |
Resizes the view so that the entire graph is visible. |
| Displays a menu with options for clearing marker for the selected block or all blocks. |
Mouse shortcuts
| Action | Description |
|---|---|
| Hover | Hovering over a block displays a preview popup with the corresponding instructions from the Assembly view. |
| Click | Selects a block and also selects the corresponding instructions the Assembly view (can be configured in the Flow Graph options) |
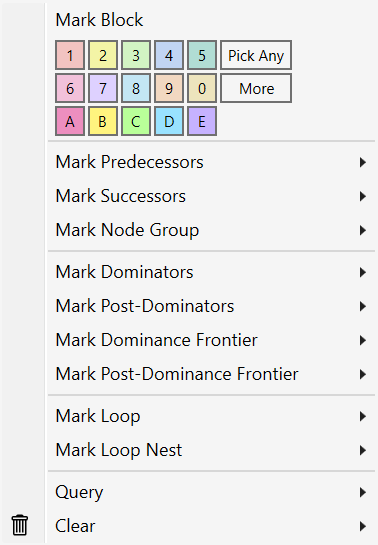
| Right-click | Shows the context menu for the selected block. |
| Click+Drag | Clicking on and dragging an empty part of the view moves the view in the direction of the mouse. |
| Scroll wheel | Scrolls the view vertically if graph is larger than the view. |
| Ctrl+Scroll wheel | Zooms in or out the view around the mouse pointer position. |
Keyboard shortcuts
| Keys | Description |
|---|---|
| Ctrl+= | Zooms in the view around the center point. |
| Ctrl+- | Zooms out the view around the center point. |
| Ctrl+0 Ctrl+R |
Resets the view to the initial state. |
| Ctrl+W | Resizes the view so that the width of the graph matches the available horizontal area. |
| Ctrl+A | Resizes the view so that the entire graph is visible. |
| Arrow keys | Scrolls the view in the horizontal and vertical directions if the flame graph is larger than the view. |
Right-click context menu
View options
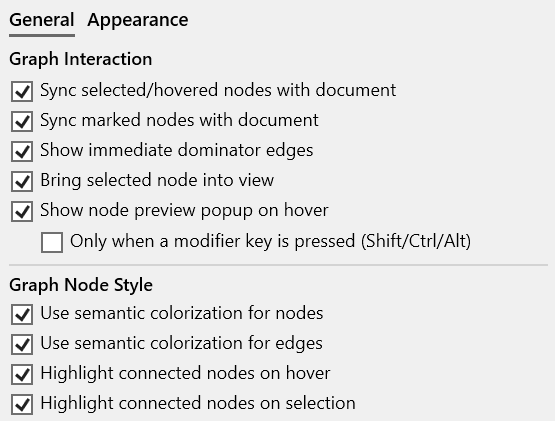
Click on the Gears icon in the top-right part of the view displays the options panel (alternatively, use the Flow Graph tab in the application Settings window.).
The tabs below describe each page of the options panel:
Documentation in progress
- View options