Profiling UI overview
Trace views
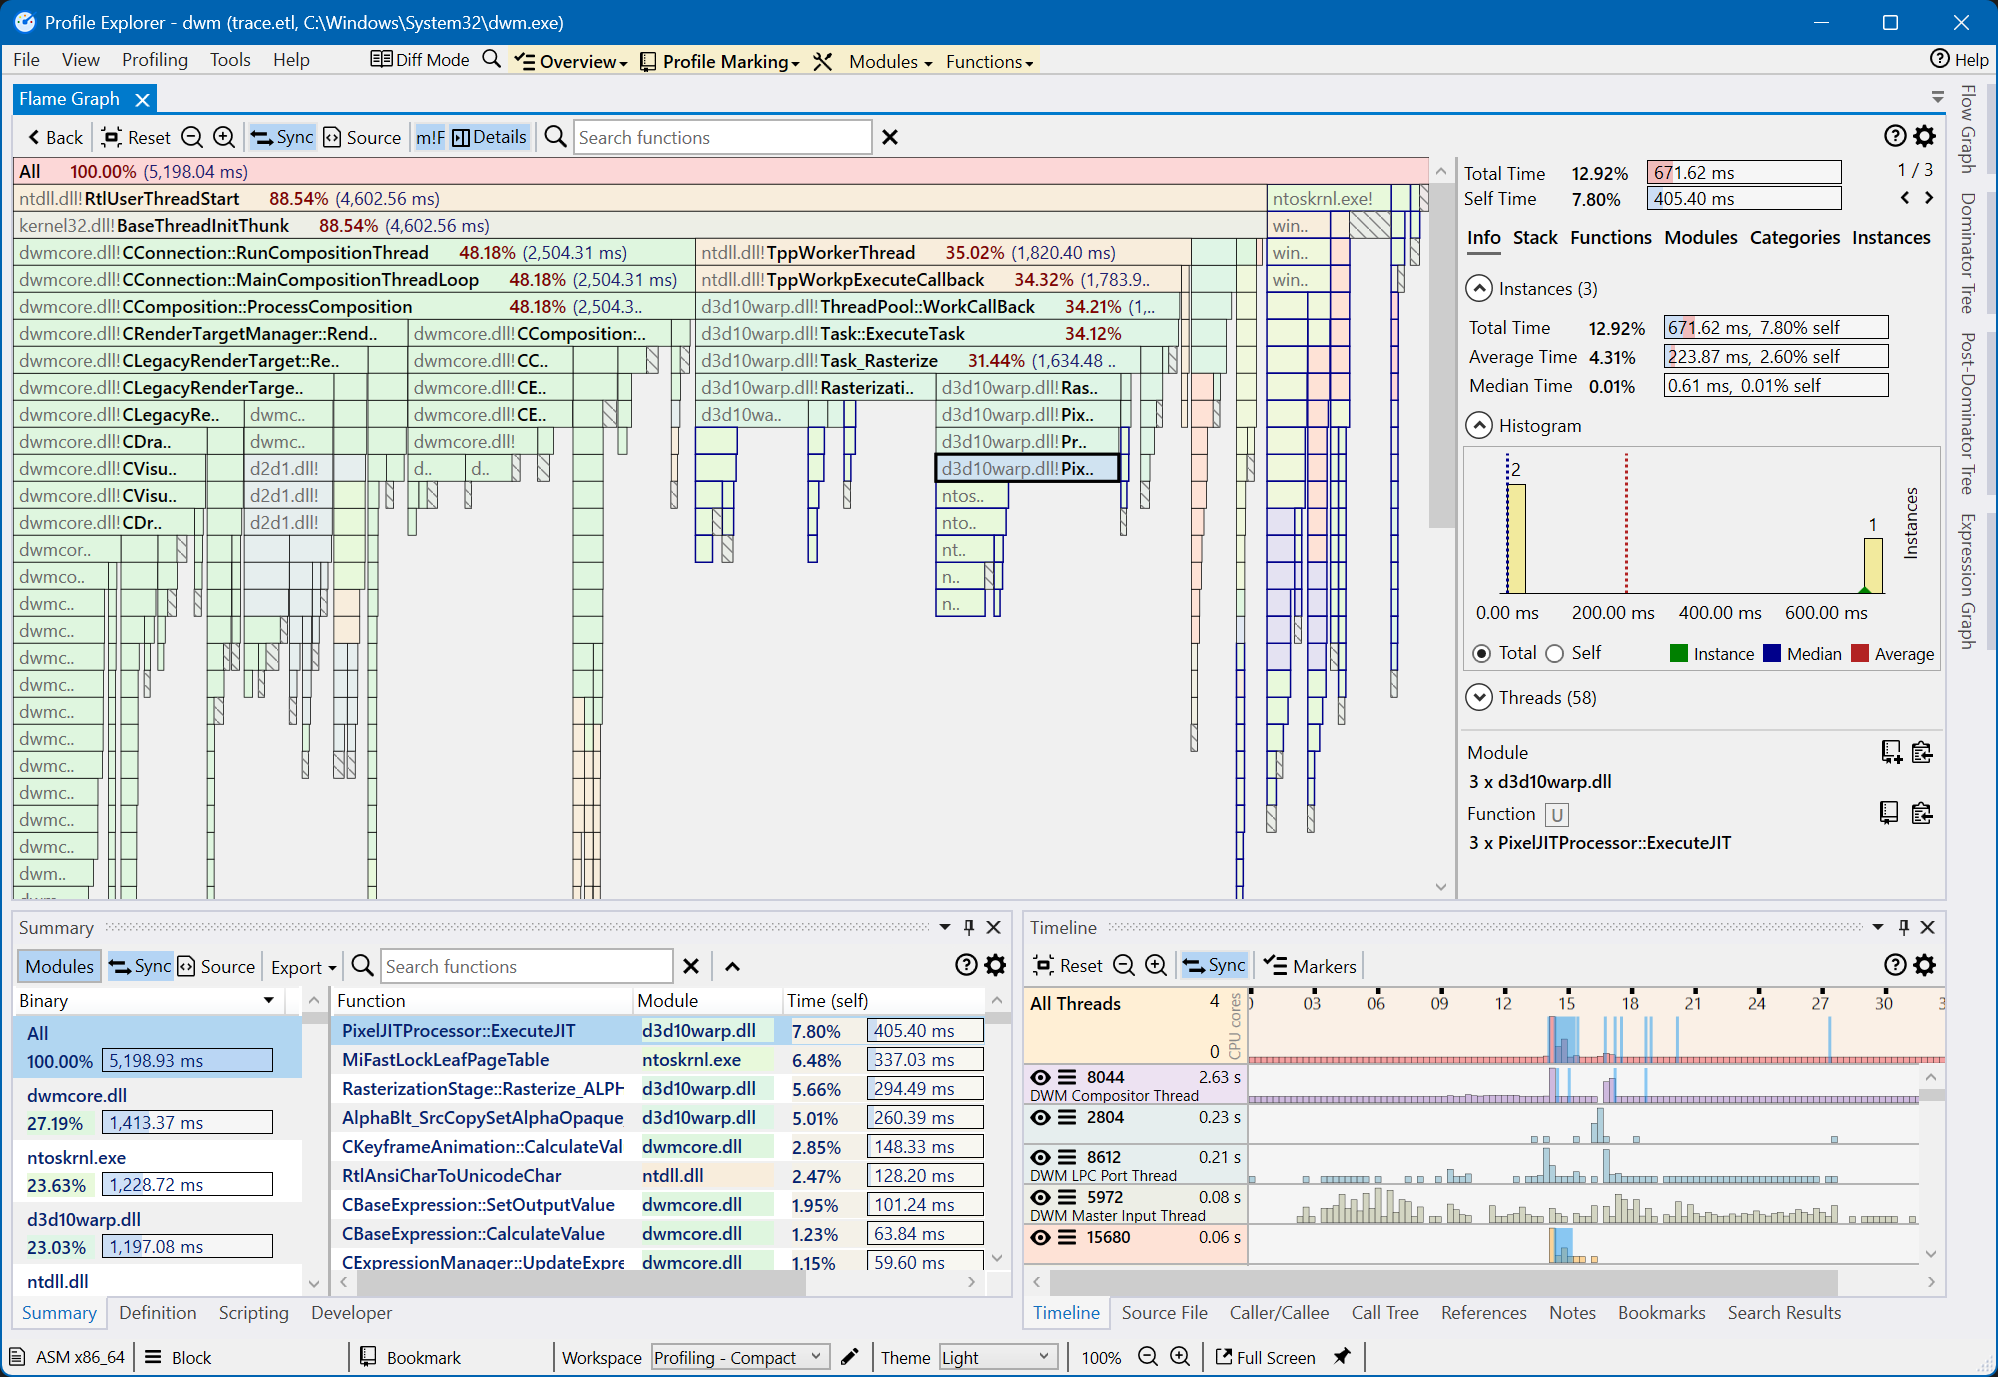
Once a trace is loaded, the Summary, Flame Graph, and Timeline views provide a high-level overview of the profiled application's slowest parts. These views allow you to identify the functions where most time is spent and when they execute.
-
Summary view: displays all the functions with profiling data, which are sorted by default based on their exclusive (self) duration.
The left side of the panel lists the modules (binaries) with profiling data, sorted based on the total time used by the functions part of the module.
-
Flame Graph view: displays an interactive Flame Graph view of the call tree. The right side of the panel shows detailed information about the selected node(s).
-
Timeline view: displays the thread activity during the entire duration of the trace and allows filtering of the displayed profiling data to specific threads and time ranges.
-
Call Tree view: displays nested call tree view showing the function call sequence for the entire trace.
-
Caller/Callee view: displays for the function selected in the Summary view the list of callers (functions calling the selected one) and callees (functions called by the selected one).
Single function views
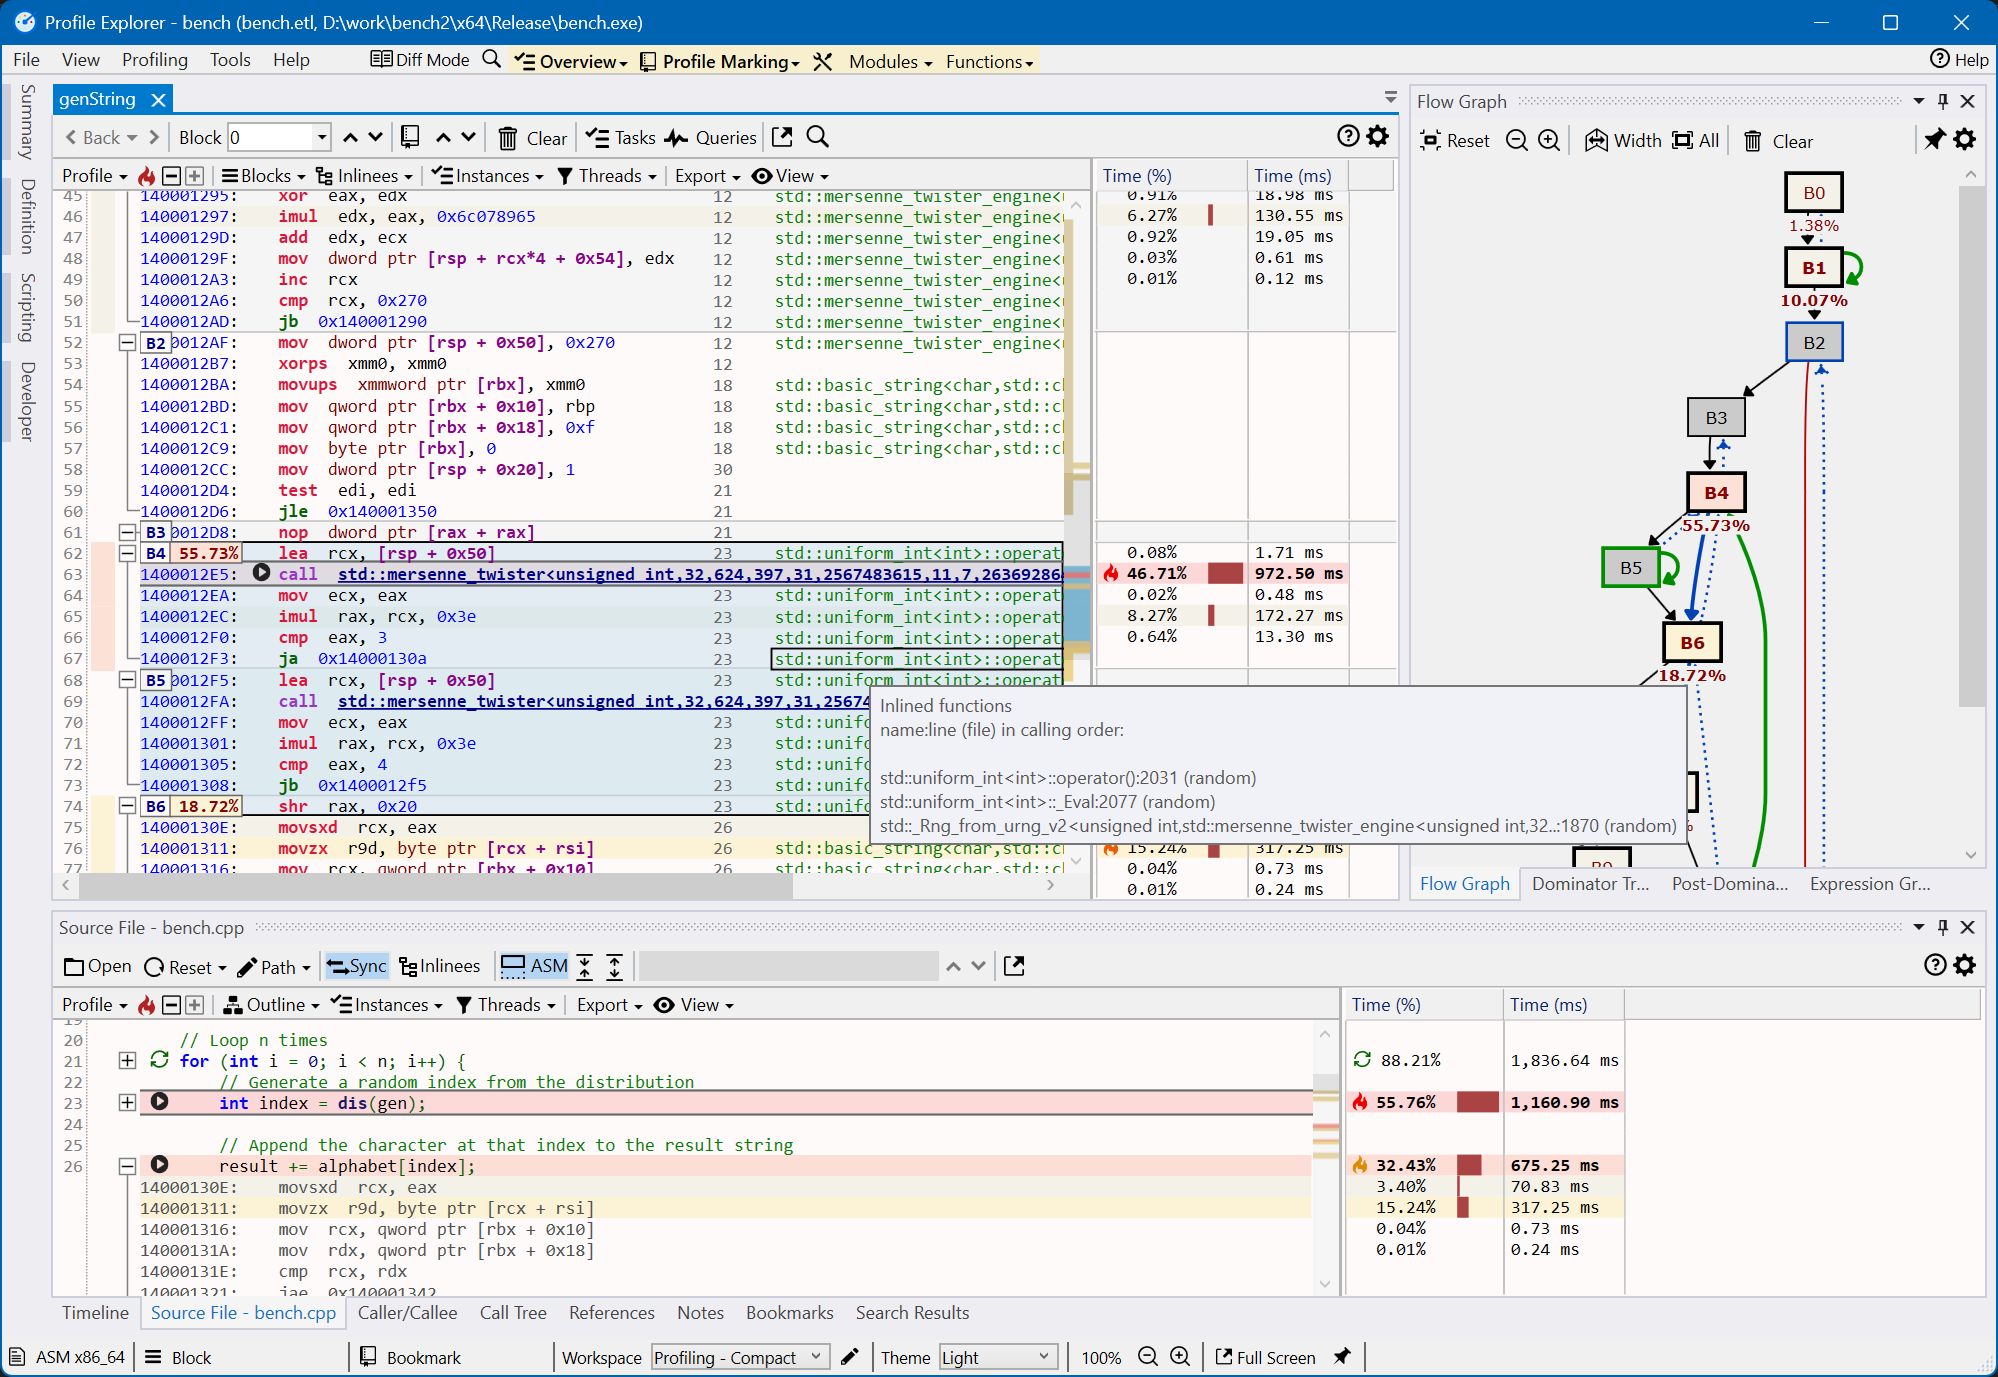
Open a function to display the Assembly, Source File, and Flow Graph views and see which parts take the most time (a double-click or the Return key in any of the views opens the function's Assembly view).
-
Assembly view: displays the function's assembly code, where each instruction is annotated with the corresponding source line number and inlining information.
The right side shows the time percentage (relative to the function's time) and time taken by each instruction. The slowest instructions are marked with colors and flame icons. Clicking an instruction selects its corresponding source line in the Source File view.
-
Source File view: displays the function's source file and, optionally, the assembly code generated for each line.
The right side shows the time percentage (relative to the function's time) and time taken by each line. The slowest lines are marked with colors and flame icons. Clicking a line selects the corresponding instructions in the Assembly view.
-
Flow Graph view: displays the function's control-flow graph, constructed by analyzing the assembly code and forming basic blocks (a sequence of instructions that starts with jump targets and ends with jumps or branch instructions).
The slowest blocks are marked with colors and labeled with the time percentage (relative to the function's time). Blocks forming a loop are marked with a green arrow.