For the Business Manager
This loan chargeoff prediction uses a simulated loan history data to predict probability of loan chargeoff in the immediate future (next three months). The higher the score, the higher is the probability of the loan getting charged-off in the future. To simplify data analysis, the loan chargeoff probability scores are grouped into High, Medium and Low categories so that loan managers can make actionable decision to offer personalized incentive to loan holders.
Loan manager is also presented with the trends and analysis of the chargeoff loans by branch locations. Characteristics of the loans that are highly probable of getting chargedoff have lower credit score for example will help loan managers to make a business plan for loan offering in that geographical area.


You can access this dashboard in either of the following ways:
-
Open the PowerBI file from the D:\LoanChargeOffSolution\Reports directory on the deployed VM desktop.
-
Install PowerBI Desktop on your computer and download and open the Loan ChargeOff Prediction Dashboard
-
Install PowerBI Desktop on your computer and download and open the Loan ChargeOff Prediction HDI Dashboard
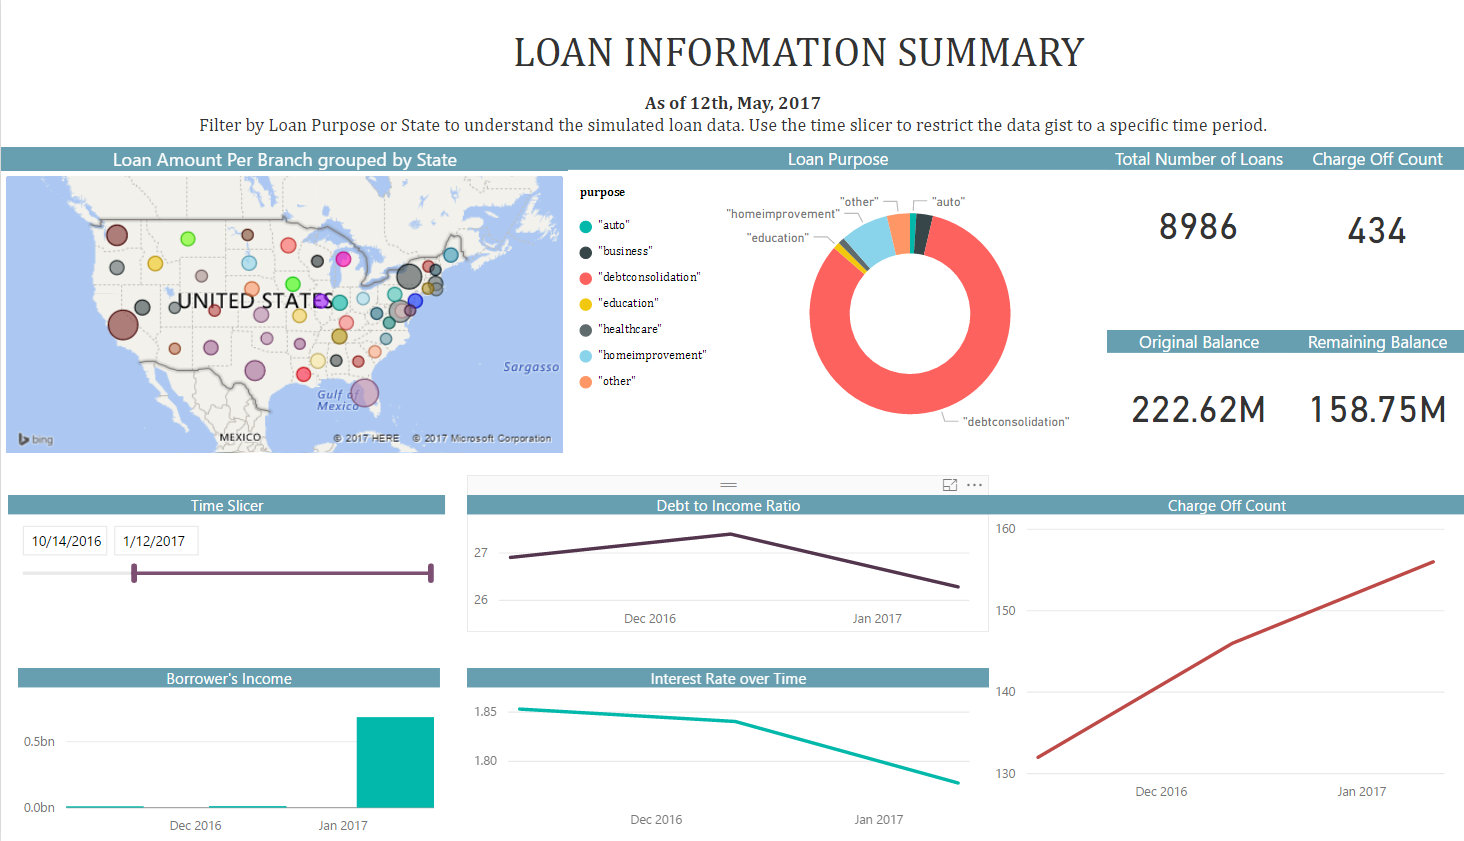
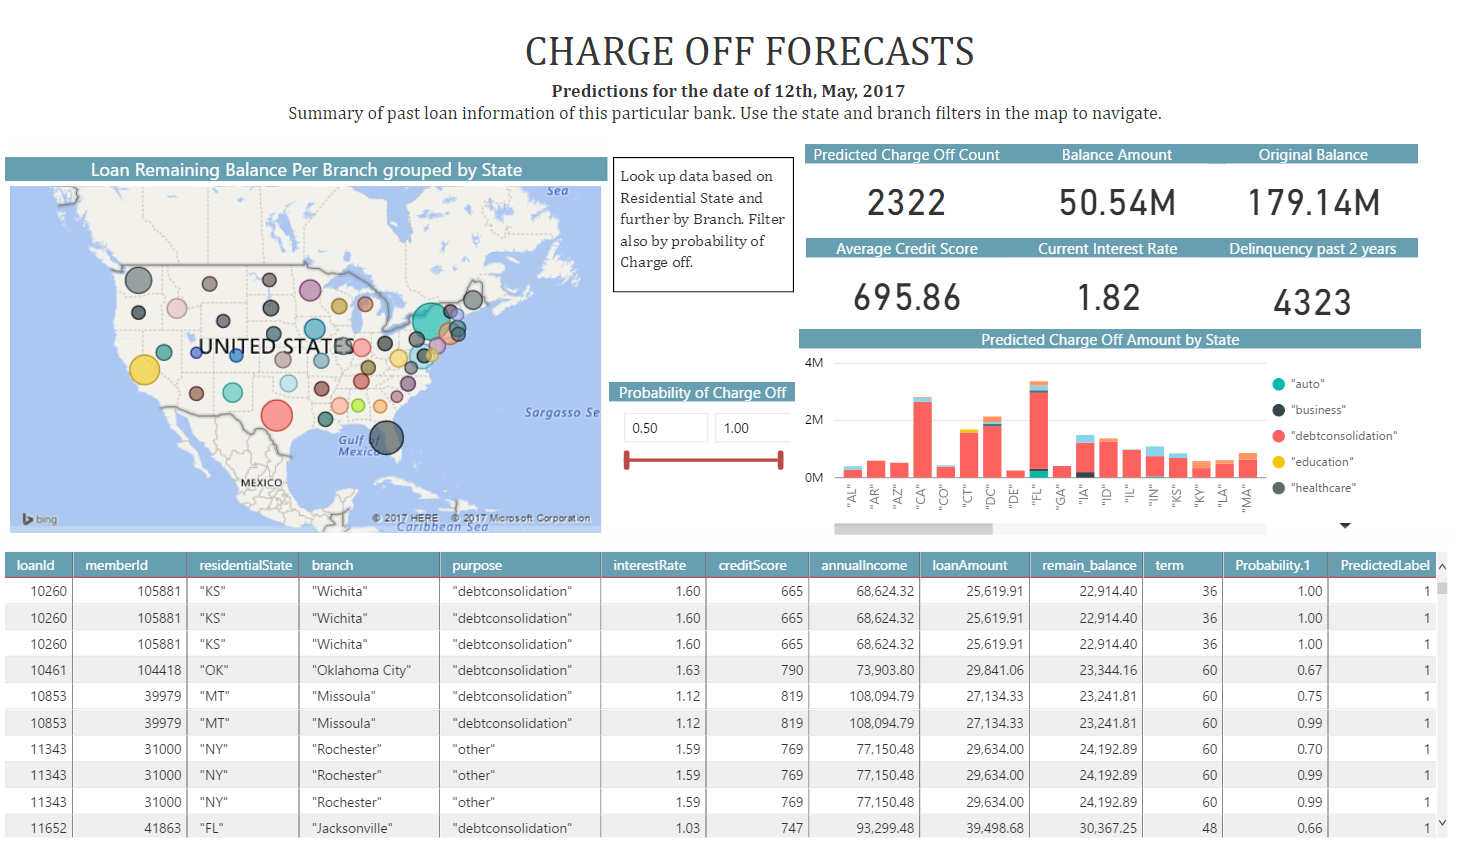
There are two tabs in the PowerBI report: (1) Loan summary tab which shows the overall loan information across different states and branches in U.S. and (2) Chargeoff risk which shows chargeoff probability in loans for loan officer to take action on.
For this specific lending institution, the loan summary tab shows the loan profiles which include information like loan types, number of loans, loan amount and charged off count. Report user can use the location map to further drill down to state and branch level and the time slider to analyze historical loan profiles.
The charge off forecast tab displays the probability of loan getting charge off in the next three months. Loan officer can further drill down into each state and branch locations to evaluate loans which have highest probability of getting charged off and their respective probability scores. High level loan holder information is also available in the report. Information like loan interest rate, loan amount, debt to income ratio, and number of delinquent payments. Loan officer can further formulate action plan to prevent loan from charging off by looking up detailed loan profile in their business application and offer personalized incentive plan to the borrower.
To understand more about the entire process of modeling and deploying this example, see For the Data Scientist.

