SQL Server ML Services takes advantage of the power of SQL Server and RevoScaleR (Microsoft ML Server package) by allowing R to run on the same server as the database. It includes a database service that runs outside the SQL Server process and communicates securely with the R runtime.
This solution package shows how to pre-process data (cleaning and feature engineering), train prediction models, and perform scoring on the SQL Server machine.
HDInsight is a cloud Spark and Hadoop service for the enterprise. HDInsight is also the only managed cloud Hadoop solution with integration to Microsoft ML Server.
This solution shows how to pre-process data (cleaning and feature engineering), train prediction models, and perform scoring on an HDInsight Spark cluster with Microsoft ML Server.
Data scientists who are testing and developing solutions can work from the convenience of their R IDE on their client machine, while setting the computation context to SQL (see R folder for code). They can also deploy the completed solutions to SQL Server (2016 or higher) by embedding calls to R in stored procedures (see SQLR folder for code). These solutions can then be further automated by the use of SQL Server Integration Services and SQL Server agent: a PowerShell script (.ps1 file) automates the running of the SQL code.
Data scientists who are testing and developing solutions can work from the browser-based Open Source Edition of RStudio Server on the HDInsight Spark cluster edge node, while using a compute context to control whether computation will be performed locally on the edge node, or whether it will be distributed across the nodes in the HDInsight Spark cluster.
Loan ChargeOff Prediction
This solution template is showing an end to end solution including platform deployment scripts, R scripts that include data transformation, feature selection, training, scoring and operationalization. This template focused on predicting loan chargeoff risk using simulated data. Loan officer can look at the top N of the loans that have the highest chargeoff probability and formulate incentive plans to encourage the loan holders to continue to payoff the loan.
Data scientist will be able to look at R script that understand the process involved in feature engineering and model performance. The script uses 5 models to train:- rxLogisticRegression, rxFastTrees, rxFastForest, rxFastLinear and rxNeuralNet. The script will pick the model with the best performance and use it in scoring.
The simulated data is loaded to SQL table for training, testing and scoring. The training output with model performance details, selected features and prediction tables are also stored as tables in SQL Server.
This template will run training, testing and scoring on 10,000 loans from the simulated datasets. There are also scripts stored in D:\LoanChargeOffSolution\Source\SQLR that data scientist can also experience running the training, testing and scoring using 100,000 and 1 million records.
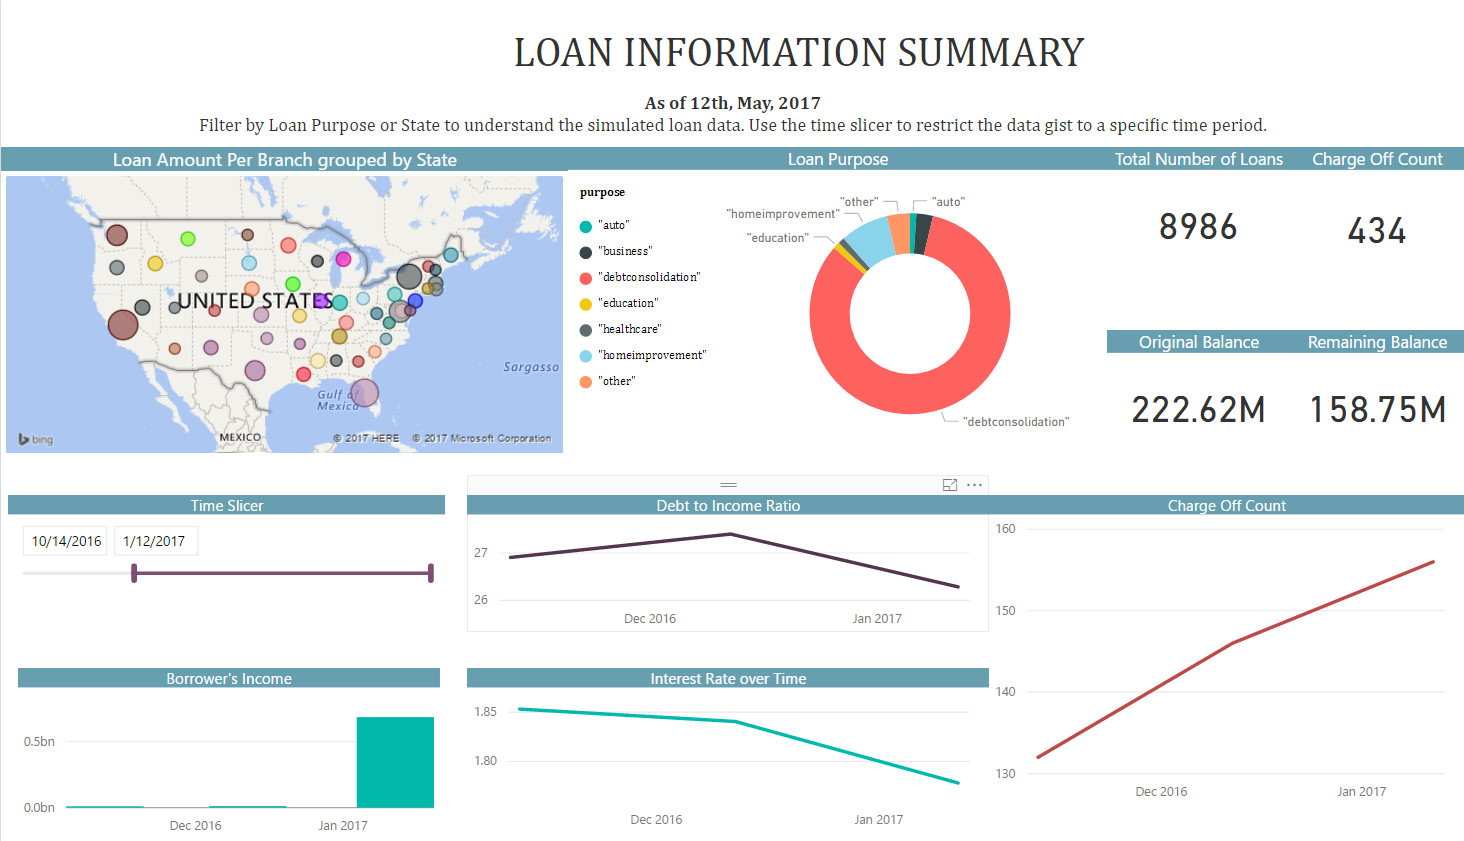
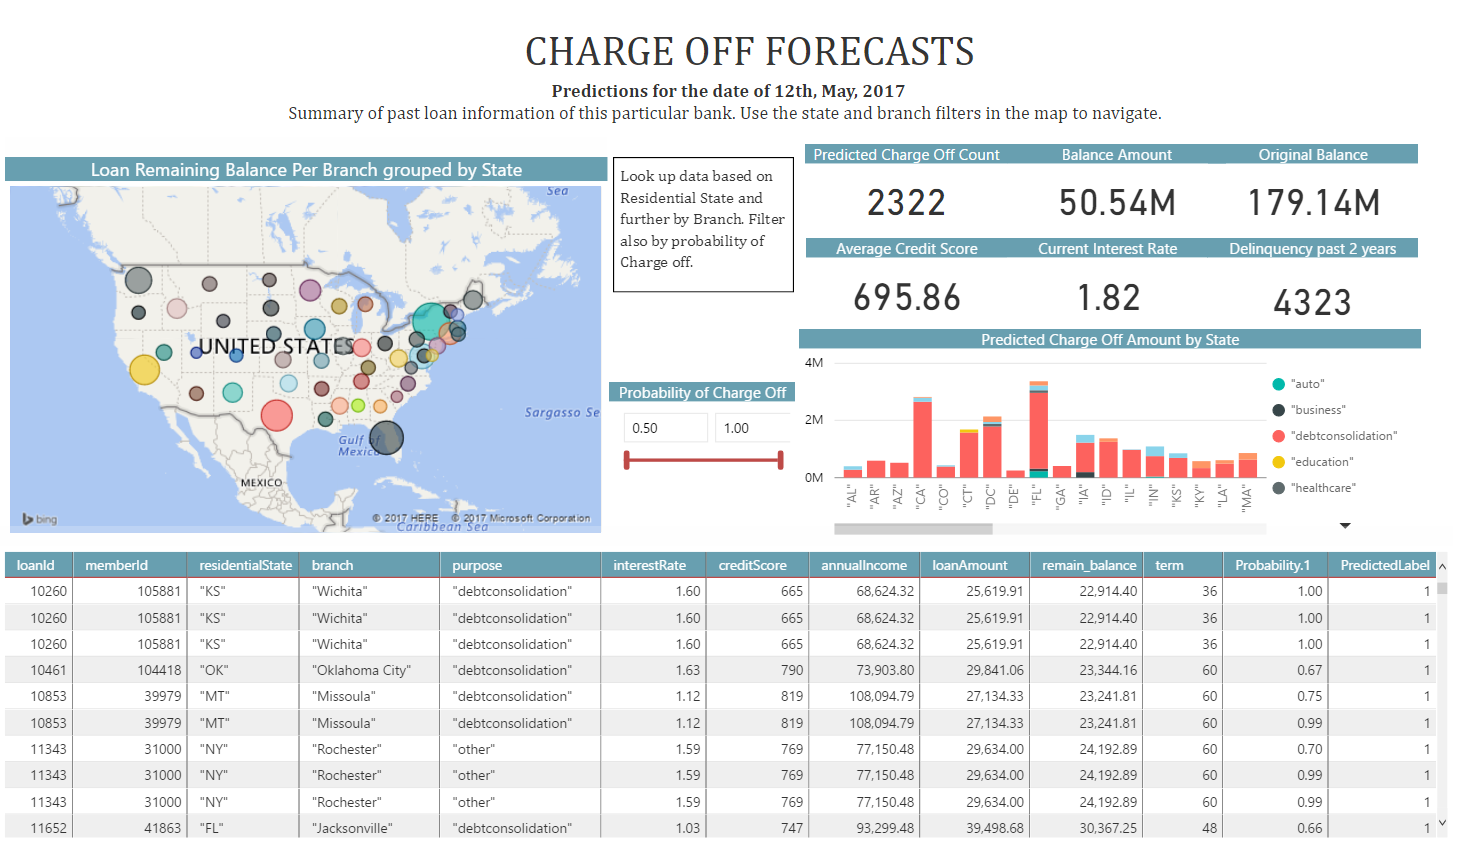
In this solution, the final scored database table in SQL Server gives the loan chargeoff predictions. This data is then visualized in PowerBI.
This template will run training, testing on 100,000 loans and scoring on 10,000 loans from the simulated datasets. The simulated datasets are stored in HDFS.
In this solution, an Apache Hive table will be created to show predictions. This data is then visualized in PowerBI.
To try this out yourself, visit the Quick Start page.
Below is a description of what happens in each of the steps: dataset creation, model development, recommendations, and deployment in more detail.
Analytical Dataset Preprocessing and Feature Engineering
In this step, raw csv data is uploaded to SQL database and processed to create denormalized views/tables to include the features and labels. Optionally a feature selection script is also included for understanding how feature selection algorithms can be used in MicrosoftML package. We use feature selection as part of modelling step later.
See the following scripts:
step1_create_tables.sql : creates tables required for importing raw data, as well as storing models and predictions.
step2_features_label_view.sql : creates views with feature and label columns based on raw data tables and persists them into tables for faster processing. The views and tables are created splitting the data into training, testing and scoring (to demonstrate batch scoring in a later step).
step2a_optional_feature_selection.sql : demonstrate feature selection using logistic regression model and stores selected features in a table.
Raw data contains all the loans in past three years and attributes for all the loans like loanId, memberId, loan_open_date, balance, pay date, payment information. Based on these information, for each opened loan and a specific pay date, calculate the payment history before the specific pay date, and then check the status in next three months to get the label to generate the input datasets. After that, this part read the input data from HDFS to create Training/Testing data, and feature engineering to select the best features.
step1_get_training_testing_data.R : This script read the input dataset from HDFS, select training/testing samples based on the pay date, performs missing value treatment on the input dataset.
step2_feature_engineering.R : This script performs feature selection to generate the features which are predictable for the modeling using featureSelection in MicrosoftML package.
1. Using rxLogisticRegression to do feature selection, figure out what's the best number of features for modeling by input different numbers. The algorithm used to do feature selection in this part can be changed to other algorithm like rxFastForest, rxFastTree and rxFastLinear. This feature selection part may take a little bit long time, so it's optional.
2. If customer do not want run the feature selection part, just give a number to parameter numFeaturesToKeep, then rxLogisitcRegression algorithm will be used the select the features and return the selected features' name for the next step.
Model Development
In this step a stored procedure 'train_model' is created to train a model based on requested algorithm and the model is evaluated and resulting stats are stored along with model binary. During deployment we use five MicrosoftML algorithms for modelling and store the resulting model binary and evaluation stats in 'loan_chargeoff_models_10k' table. Modelling includes feature selection and categorization using 'categorical' and 'selectFeatures' transforms from MicrosoftML.
See the following script : step3_train_test_model.sql
Five models, Fast Forest, Logistic Regression, Fast Tree, Fast Linear and Neural Network are developed to predict charge-off loans in next three months. The R code to develop these models and evaluate the models' performance using testing dataset in step3_training_evaluation.R.
After creating the training and testing set in step1 and get the selected features' name in step2, fives prediction models are built on the training set using selected features. Once the models are trained, AUC, TPR and TNR of these five models are calculated using the testing set.
The R script draws the ROC for each prediction model. It shows the performance of the model in terms of true positive rate and false positive rate, when the decision threshold varies.
The AUC is a number between 0 and 1. It corresponds to the area under the ROC curve. It is a performance metric related to how good the model is at separating the two classes (charge-off loans and not charge-off loans), with a good choice of decision threshold separating between the predicted probabilities. The closer the AUC is to 1 and the better the model is. Given that we are not looking for that optimal decision threshold, the AUC is more representative of the prediction performance than the Overall Accuracy. Since the training data is very skew (the number of not charge-off loans is much larger than the number of charge-off loans), TPR and TNR are calculated since AUC should be high with lower TPR and higher TNR for unbalanced training data. TPR and TNR can combine with AUC together to measure the models' performance and guarantee the model with best AUC also has better TPR and TNR.
The model with best AUC is selected as the champion model and will be used for prediction.
Given training/testing datasets and selected features' name, this script can be run manually. Not that all the algorithms in this step take the selected features, it also can be changed to input all the features in the training set, and let all the algorithm to select the best features by using selectFeatures function in MicrosoftML and then compare the performance of the models based on the same testing set.
Computing ChargeOff Predictions
In this step two stored procedures are created 'predict_chargeoff' and 'predict_chargeoff_ondemand'. 'predict_chargeoff' procedures performs batch scoring on the data split created in preprocessing step and stores the predictions in 'loan_chargeoff_prediction_10k' table.
'predict_chargeoff_ondemand' stored procedure is created for ad-hoc scoring wherein it can be called with a single record and a single prediction result is returned to the caller.
See the following scripts:
step4_chargeoff_batch_prediction.sqlstep4a_chargeoff_ondemand_prediction.sql
The champion model is used to provide predicted results for all the opened loans about which loans will be charge-off with what probability. The R code to provide the prediction is included in the step4_prepare_new_data.R and step5_loan_prediction.R scripts.
step4_prepare_new_data.R : This script creates a new data which contains all the opened loans on a pay date which we do not know the status in next three month, the loans in this new data are not included in the training and testing dataset and have the same features as the loans used in training/testing dataset.
step5_loan_prediction.R : This script takes the new data created in the step4 and the champion model created in step3, output the predicted label and probability to be charge-off for each loan in next three months.
Deploy and Visualize Results
Chargeoff prediction result stores in SQL Server table. The final step is to connect PowerBI report to SQL Server and visualize the scoring result. The sample PowerBI is shipped in this solution template. However, user can customize the PowerBI report according to their business needs.
Deploy
The script loanchargeoff_deployment.R creates and tests a analytic web service. The web service can then be used from another application to score future data. The file loanchargeoff_web_scoring.R can be downloaded to invoke this web service locally on any computer with Microsoft ML Server installed.
Before running loanchargeoff_web_scoring.R on any computer, you must first connect to edge node from that computer.
Once you have connected you can also use the web server admin utility to reconfigure or check on the status of the server.
Follow instructions here to connect to the edge node and/or use the admin utility.
Visualize
The final step of this solution visualizes these recommendations.
You can access this dashboard in either of the following ways:
Open the PowerBI file from the D:\LoanChargeOffSolution\Reports directory on the deployed VM desktop.