For the Business Manager
This solution is based on simulated data for a small personal loan financial institution, containing the borrower’s financial history as well as information about the requested loan. It uses predictive analytics to help decide whether or not to grant a loan for each borrower.
The PowerBI dashboard allows you to visualize and use these predicted scores to aid in deciding when to approve a loan. There are two different tabs: the Test Data tab lets you explore the scores in the test data in order to decide on a cutoff value to use in the decision to reject a loan. The Prod Data tab shows new potential loans in the production pipeline where you can view the results of using this cutoff value.
Test Data Tab
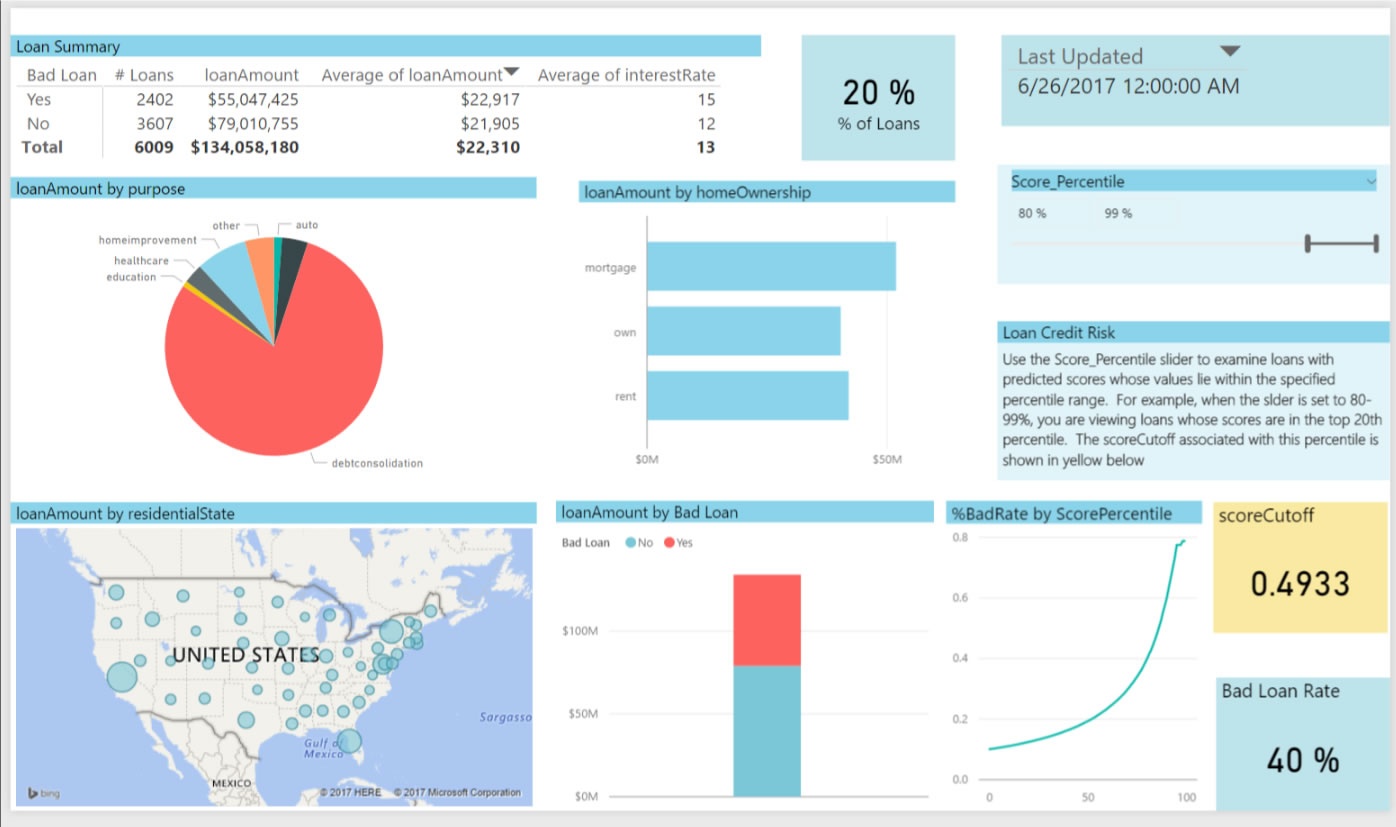 The output scores from the model have been binned according to percentiles: the higher the percentile, the more likely the risk of default. On the Test Data tab, you can use the slider at the top right to examine loans in the test data that correspond to these percentiles. The slider at the is set to show the top 20% of scores (Score Percentile from 80-99%). The box in yellow will show the corresponding cutpoint that can be used to classify these loans as bad. The default value of .4933 (corresponding to the top 20% in the training data) is used in the Loan Summary tab.
The Loan Summary table divides those loans classified as bad in two: those that were indeed bad (Bad Loan = Yes) and those that were in fact good although they were classified as bad (Bad Loan = No). For each of these 2 categories, the table shows the number, total and average amount, and the average interest rate of the loans. This allows you to see the expected impact of choosing this cutoff value.
New Loans Tab
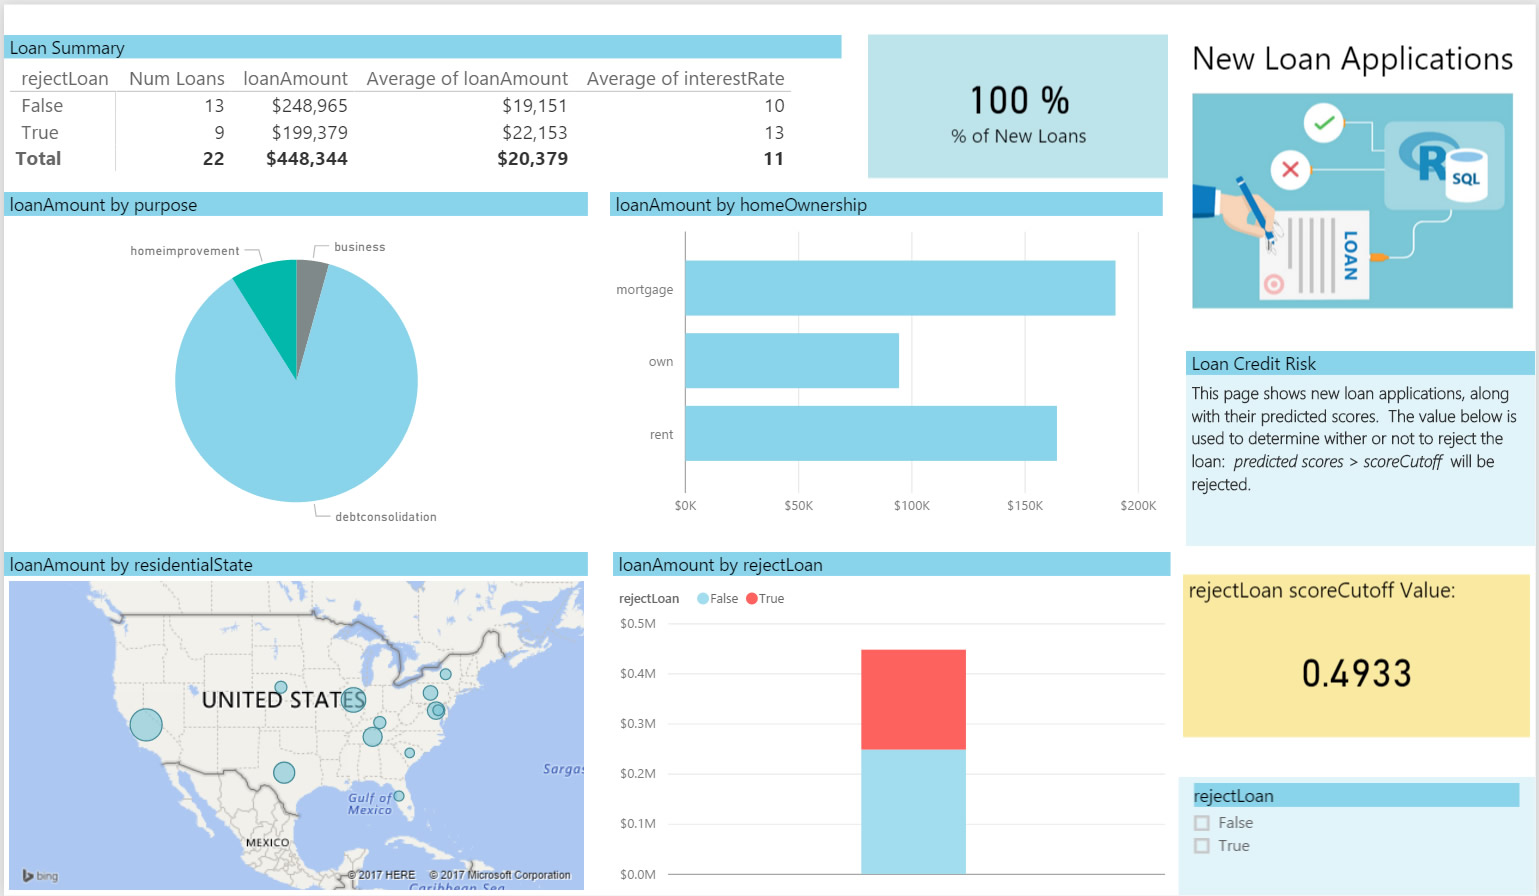 On the New Loans tab you will see some scored potential loans. This page is using .4933 as the cutoff value. You will reject 9 of the 22 potential loans based on this critera. (With PowerBI Desktop, you can change this cutoff to a different value.)
You can access this dashboard in any of the following ways:
-
Open the PowerBI file from the Loans directory on the deployed VM desktop.
-
Install PowerBI Desktop on your computer and download and open the LoanCreditRisk.pbix file.
-
Install PowerBI Desktop on your computer and download and open the LoanCreditRisk HDI.pbx file.
To understand more about the entire process of modeling and deploying this example, see For the Data Scientist.