Dashboard Lab (Experimental)
waza serve --lab opens the experimental real-results dashboard at /#/lab.
The classic dashboard remains available at /#/ on the same server. The Go
evaluation engine is unchanged; the lab is a viewer, not an execution service.
 🔍 Click to enlarge
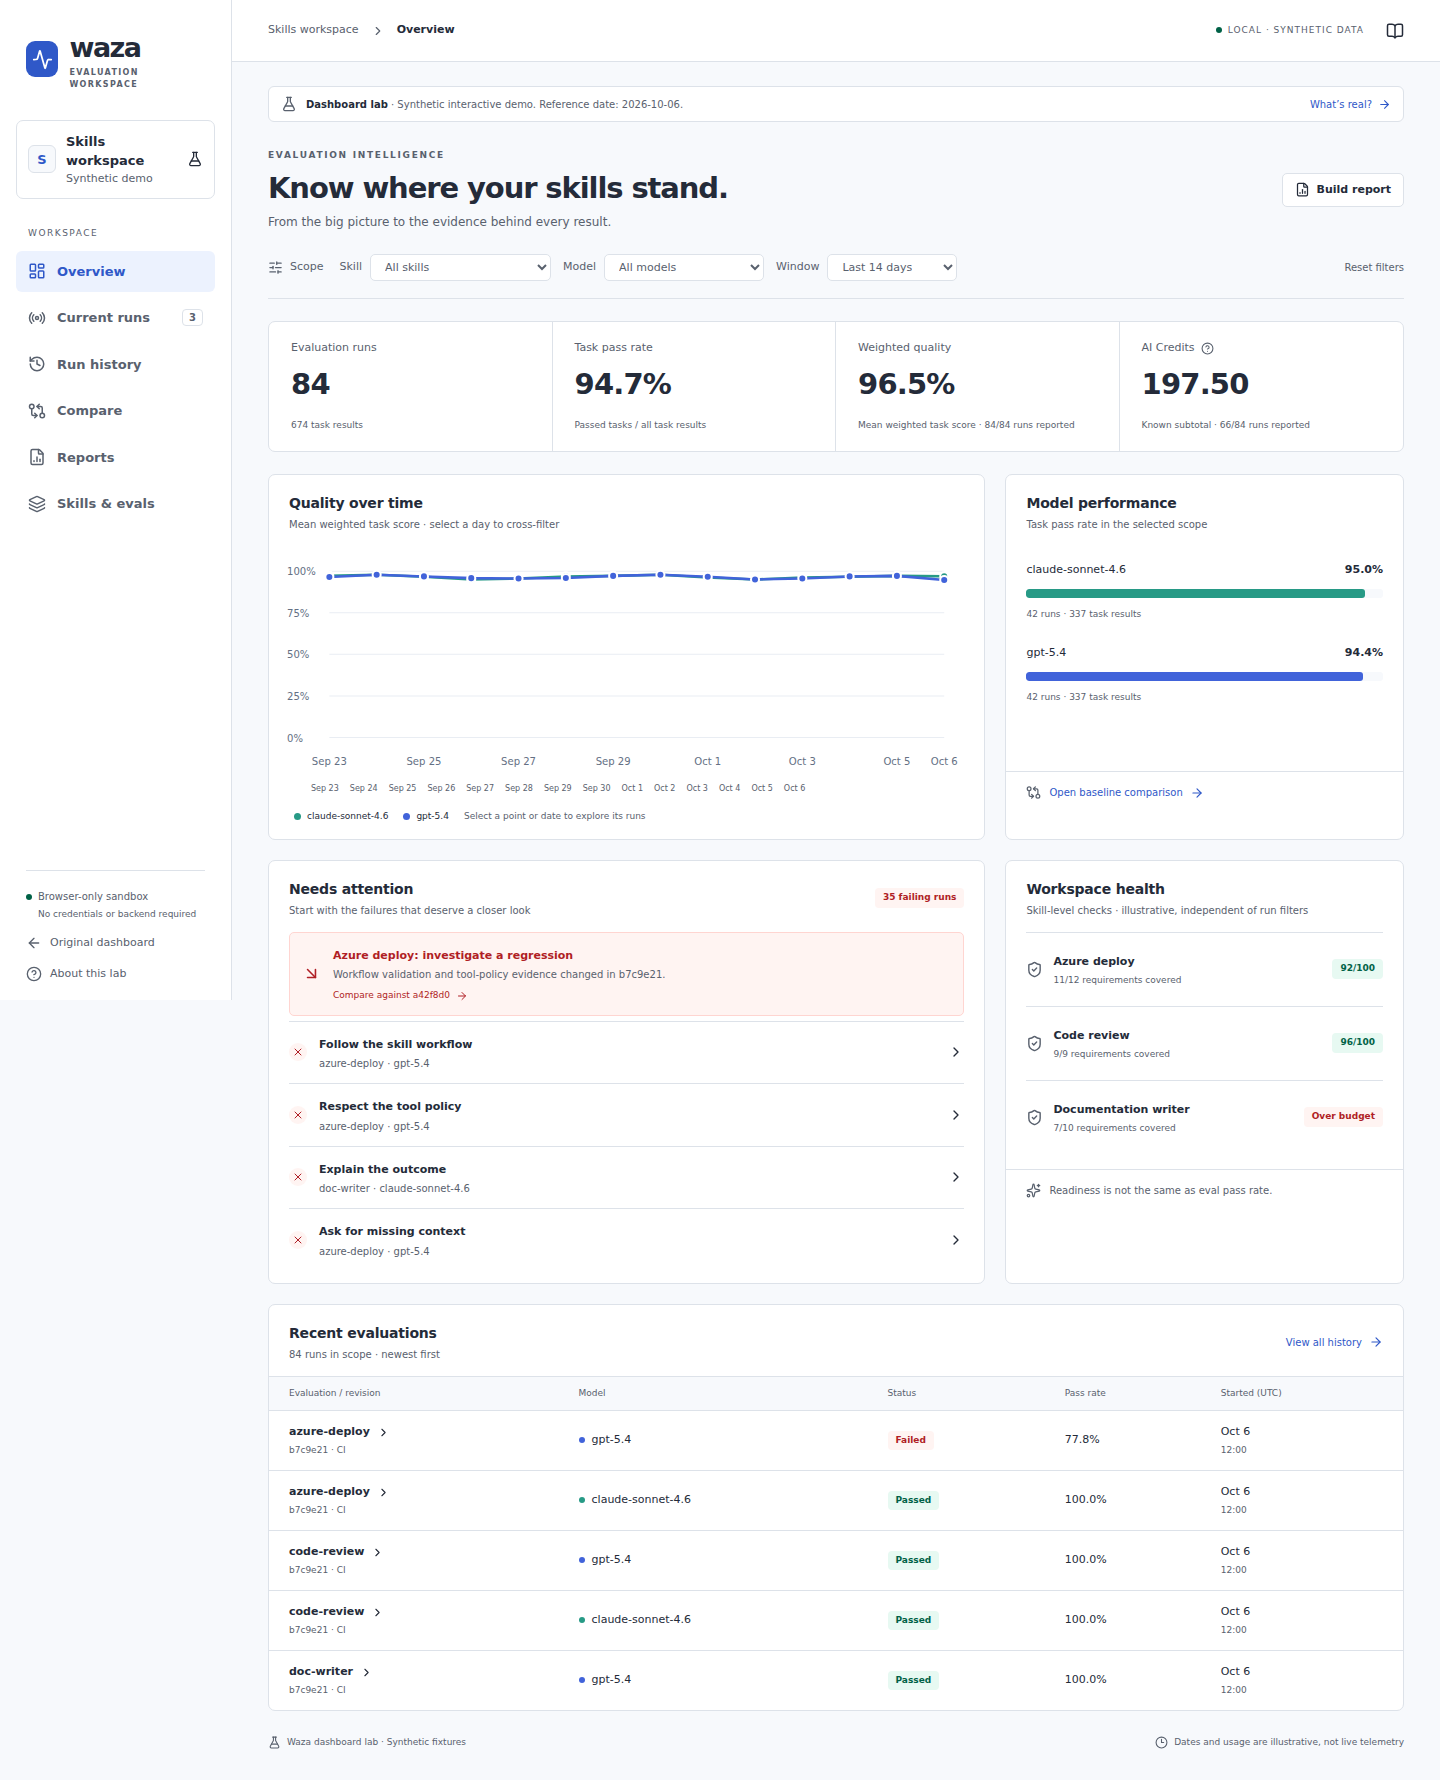
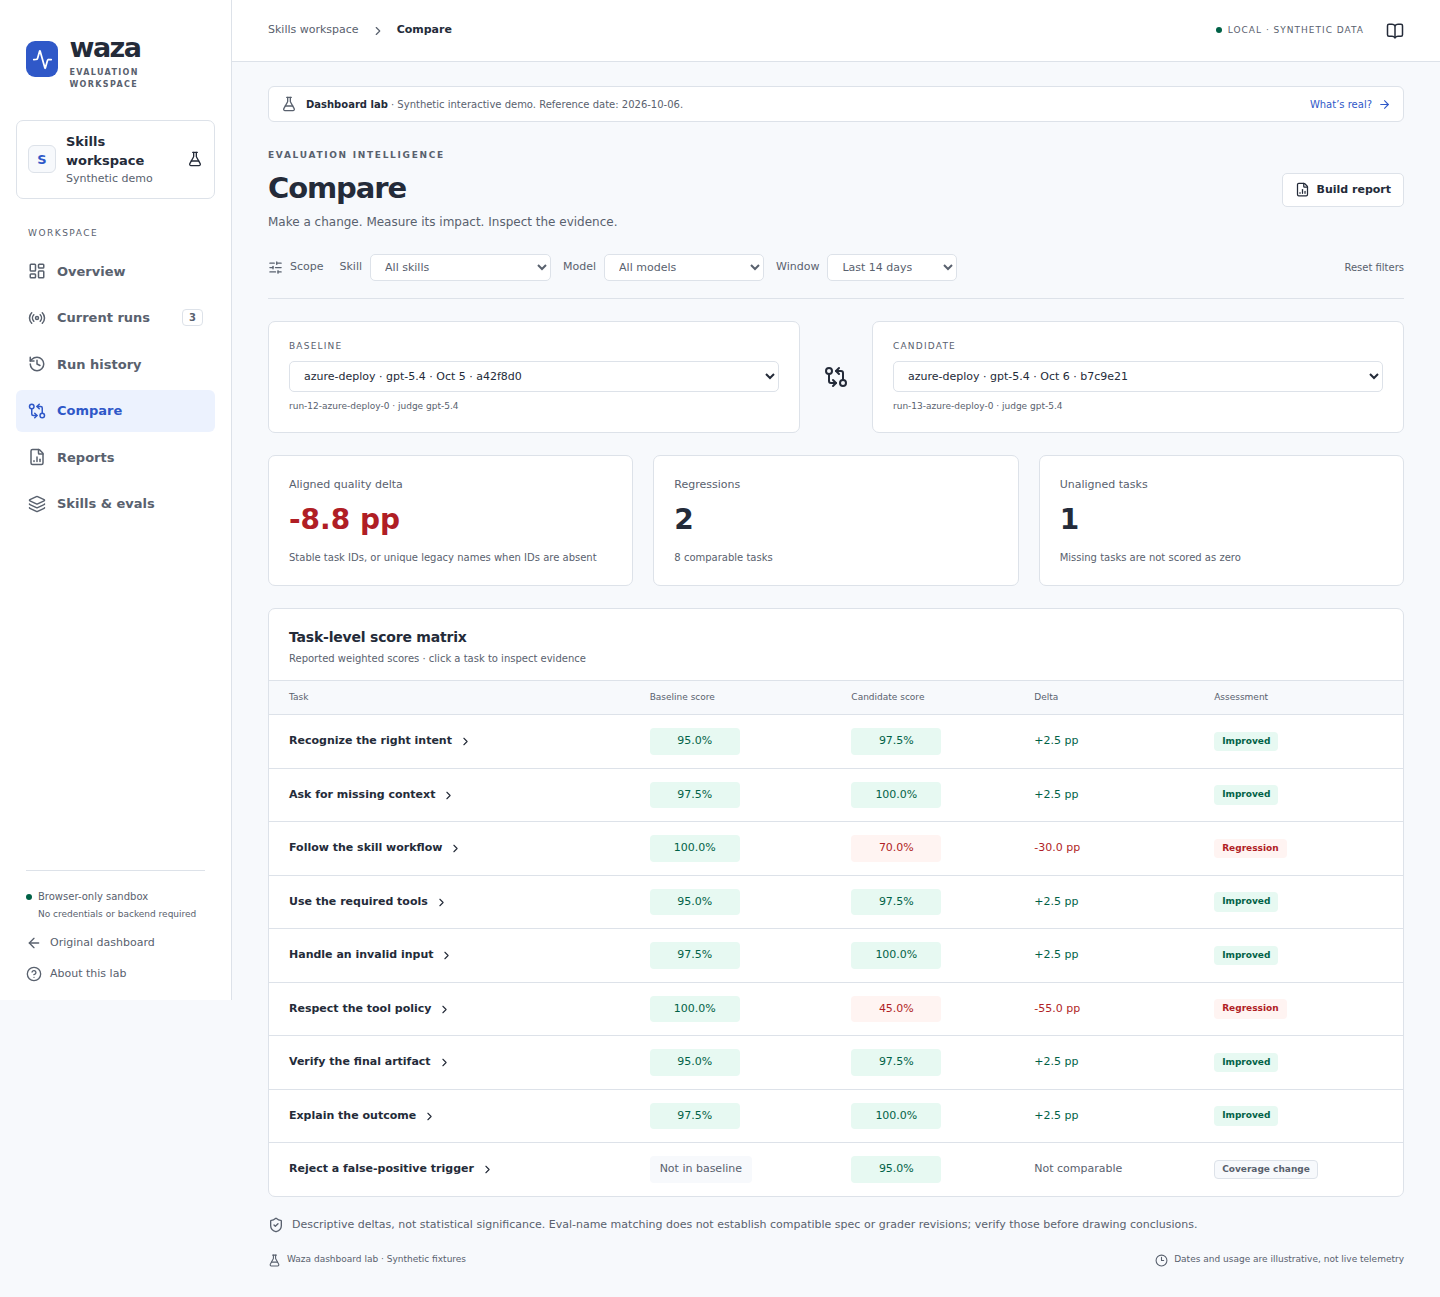
The screenshots show the separately labeled synthetic demo at /#/lab/demo.
The default lab reads your saved Waza results, never substitutes synthetic data
on errors, and labels unsupported metadata as unavailable.
Run locally
Section titled “Run locally”For a dashboard built from this source tree:
waza serve --lab --results-dir ./results --no-browser# Open http://localhost:3000/#/lab# Classic dashboard: http://localhost:3000/#/--lab chooses the printed and auto-opened URL. It does not redirect the root
or replace classic views. --lab and --tcp are mutually exclusive. The server
keeps its existing loopback bind; no cloud authentication or hosting is added.
Local artifacts refresh every 15 seconds or with Refresh results. Once summaries identify a remote archive, automatic polling stops: use Refresh results to reload it explicitly rather than repeatedly downloading every remote artifact. Empty archives keep checking for their first saved result. Storage-backed results use the existing configured storage adapter. Loading, refresh failures, stale results, and retry actions are visible. The default window is All time, so older histories remain accessible. Successful summary refreshes also refresh mounted inspector and comparison evidence, even when regrading keeps the run ID and timestamp unchanged. Failed refreshes retain previously loaded summaries and evidence; a failed local reload does not discard the classic dashboard’s cached artifacts. Comparison evidence is refreshed as one selected pair. If either detail request fails, both previously loaded members and a comparison-bound inspector retain the last wholly successful pair, with the actual refresh error shown. An explicit retry or a later local refresh replaces both members together. Selecting a different pair loads its own evidence; this is not a transaction across backend artifacts or unrelated inspectors. Remote archives still refresh only on demand. The inspector retains a selected task while it still exists; if a refresh removes it, both the selector and evidence use the first remaining failed task, or the first remaining task when none failed. Empty task sets have no task selection. That resolved fallback becomes the selection: reintroducing a removed task does not switch back to it unless you explicitly select it. Initial summary-only loading does not reset a requested task. This refresh also applies when storage is enabled with the local/default backend. An incomplete or invalid rewrite of a previously loaded artifact reports a refresh error and retains the prior snapshot. Intentional file deletion is reflected after a successful scan; unrelated malformed new files remain ignored. An uncreated empty results directory remains empty across refreshes. Inaccessible new unrelated paths are skipped; failures affecting the root or previously admitted artifacts retain explicit errors and the prior snapshot.
For frontend-only exploration of the synthetic demo, no Go server is needed:
cd webnpm cinpm run dev -- --host 127.0.0.1# Open the URL printed by Vite, followed by /#/lab/demoA previously installed Waza release does not gain the lab merely by checking out this source. Build the frontend and binary to embed the updated dashboard, or use the frontend-only development workflow above.
Explore the real-results dashboard
Section titled “Explore the real-results dashboard”| Workspace | Working interactions |
|---|---|
| Overview | Eval/skill/model/window filters, selectable quality-chart dates, model cross-filtering, failing-run drilldown |
| Current runs | Select a saved run and inspect artifact-derived SSE activity; reconnection, deduplication, and terminal states |
| Run history | Search, outcome filters, evidence inspection, and selection of two runs from the same eval |
| Compare | Baseline/candidate selection, reported weighted task-score deltas, regression evidence, added/missing task coverage |
| Reports | Filtered JSON/CSV downloads and browser print/save-PDF |
| Skills & evals | Suites observed in run history; readiness, requirement coverage, and skill token budgets explicitly unavailable |
Try Overview → failing run → Grader evidence → Trajectory → Reports. The inspector uses actual recorded prompts, graders, session digests, responder metadata, model usage, and the existing trajectory viewer. It supports keyboard focus containment, Escape to close, and focus restoration. Detail artifacts are loaded on demand rather than downloading all transcripts for the overview. Evidence tabs use a single Tab stop with ArrowLeft/ArrowRight, Home, and End to move focus and selection. Nullable task/grader arrays are empty recorded evidence, not errors or invented scores, including in JSON reports.
 🔍 Click to enlarge
The real-results Skill and Eval controls are independent: select one
eval when a skill has multiple suites, or combine both to narrow the scope.
Eval selection matches the stored eval identity even when skill metadata is
absent; identical skill and eval names are not interchangeable. All evals
and Reset filters clear the eval restriction. The synthetic demo retains
its existing skill-only filter.
History search also matches the recorded eval identity, independently of the
Eval dropdown. Missing or blank skill metadata displays Unavailable but
does not become a skill identity or filter option. An authored skill named
Unavailable remains a real, selectable skill. Inspector configuration and JSON
reports preserve absent skill fields rather than replacing them with the eval
name or a presentation label. Observed-suite links scope by their actual eval
identity, including suites with no recorded skill.
Saved-result decoding, storage, and the summary/detail API preserve an explicitly
recorded "skill": "" as a blank string. An absent or null skill is unavailable
and omitted from the API, not inferred from the eval name. Rewriting a decoded
artifact retains that distinction, including historical nested baselines.
waza grade --output also preserves recorded skill presence and original run
provenance while updating grading fields and the result writer version.
The sidebar reports the same refresh policy as the results status: local archives refresh every 15 seconds, while remote archives refresh on demand. Before the first archive response, it shows that the refresh policy is loading.
Scope filters apply to historical summaries, tables, comparisons, reports, the observed catalog, and activity run selection. Selecting a chart date filters runs while the trend retains the time-window context.
Current runs is saved-result replay, not an active-worker monitor. The
existing API reconstructs task/grader events and timestamps from result
artifacts. Browser reconnections resume with Last-Event-ID. The lab closes
terminal or malformed streams, reports connection errors, and clears activity
when the selected run changes. Start/cancel/retry controls and real execution
discovery are not available.
Retrying connections show Reconnecting while the browser is attempting to
reopen them. Permanently closed connections show an error and require Reconnect
stream; they do not claim an automatic retry is in progress.
Data honesty
Section titled “Data honesty”- A task pass rate is distinct from its weighted quality score.
- Task scores aggregate repetitions; grader evidence and trajectories describe the first repetition, not every trial. Missing weighted scores remain unavailable. Omitted or null task/suite weighted-score fields are not recorded zeroes; explicit numeric zero remains a valid recorded score.
- AI Credits use authoritative API values, never token-derived estimates. Unknown billing is shown as unavailable; aggregate credit values are explicitly known subtotals, with reporting coverage.
- Baselines are scoped to the same nonempty eval identity. Tasks align by stable IDs, or unique legacy names when both artifacts lack IDs. Duplicate identities are non-comparable, not silently paired. Added/missing tasks are not comparable, not zero-score regressions. The candidate picker remains available for singleton suites; only comparison evidence requires a matching baseline.
- Comparisons are descriptive, not claims of statistical significance.
- Eval names do not prove matching spec/grader revisions; verify compatibility before drawing conclusions. Git revisions and full configurations are unavailable.
- JSON exports have their own report format marker and
synthetic: false, with selected API run details. Detail downloads use bounded concurrency; any failure aborts the export without downloading a partial report. These reports are not WazaEvaluationOutcomeartifacts. CSV preserves numeric credit precision and leaves unknown fields empty; browser print can save a PDF.
Isolated synthetic demo
Section titled “Isolated synthetic demo”/#/lab/demo retains the original UX mock with deterministic 84-run fixtures
dated October 6, 2026, illustrative configuration/readiness/CI metadata, and
browser-only current-run playback. Try Overview → Azure deploy regression →
Respect the tool policy → Grader evidence → Trajectory → Reports.
This demo makes no API requests, never executes evaluations, and exports
synthetic: true reports. Playback jobs are separate from historical reports.
It is never selected automatically after a real-data error.
Research and design rationale
Section titled “Research and design rationale”Research observed on 2026-10-06. These are independently verified reference patterns, not copied implementations or promises of feature parity.
| Reference | Verified capability | Waza design implication |
|---|---|---|
| Aspire dashboard | Resource state in AppHost mode; logs, traces, metrics, correlated inspection; standalone OTLP viewer | Treat current runs and evidence inspection as first-class operational workspaces, not just charts |
| Flint Chart | Semantic chart specs, visual themes, multiple rendering backends | Make chart meaning and visual conventions consistent across reports |
| Flint interactions | Highlighting, linked brushing, navigation, annotations, keyboard targeting; documented interaction_spec support on the Vega-Lite interactive surface |
Connect chart selection to application-level filters and task evidence |
| Vally serve | Results-directory serving, optional SQLite history, paginated REST API, score matrix, rankings, grader/tool analysis, comparison | Separate queryable historical analytics from artifacts and foreground grader failure analysis |
| Vally dashboard source | Chart.js charts for duration, tokens, results/tool distributions; all-outcomes exploration and model comparisons | Use comparison and score matrices to explain outcomes, rather than a wall of aggregate charts |
| Braintrust comparisons | Baselines, aligned test cases, regression/improvement deltas, report export | Make regression → evidence → shareable report a coherent journey |
| Promptfoo web UI | Search/filterable result tables, cell inspection, comparison, config visibility, exports | Preserve a dense evidence table alongside visual exploration |
| Langfuse datasets | Project-scoped datasets with inputs, expected outputs, and experiment workflows | Give eval suites and their versions a visible home rather than only listing executions |
Vally’s inspected dashboard/server surfaces were oriented toward stored outcome analytics. We did not find an SSE live-run or execution-control UI there. Its configurable network bind and host-header protections do not constitute a complete authenticated multi-user cloud service. This is a scoped source observation, not a claim that Vally cannot add those capabilities.
This prototype uses native SVG/React charts inspired by Flint, not the Flint package. It implements date/model cross-filtering; it does not claim linked brushing, pan/zoom, or every Flint preset. A future integration should evaluate Flint’s Vega-Lite interactive surface, route semantic events into shared filter state, validate per-chart interaction support, and measure bundle/runtime cost. It need not use Flint’s hosted MCP service or send private eval data anywhere.
Waza feature coverage
Section titled “Waza feature coverage”The lab makes room for the full lifecycle, but does not implement every CLI command in the browser.
| Existing Waza surface | Prototype representation | Production work still needed |
|---|---|---|
| Skill/custom-agent authoring, scaffolding, suggestions | Skills/evals catalog and capability map | Suite discovery, editing, validation, registry/lock provenance |
| Sensei/readiness, tokens, spec verification, coverage | Illustrative per-skill quality/coverage/budget | Real check/coverage outputs and artifact links |
| Eval model, judge, repetitions, weighted graders | Real history, recorded metadata, score matrix, grader evidence | Full-fidelity repetition-level data and configuration |
| Triggers, responders, command mocks, fixture isolation | Configuration/capability map | Dedicated outcomes, sanitized command evidence, invocation inspection |
| Custom-agent tool policies | Actual digest/trajectory denials in the inspector; illustrative demo denial | Richer invocation and policy analysis |
| Token, request, per-model AI Credit diagnostics | Real summary totals, precise credits/coverage, task digest, model usage in recorded metadata | Dedicated session-ledger and per-model analysis views |
| Snapshot/replay, adversarial packs, telemetry | Trajectory and capability map | Real snapshot/fault-pack links and trace correlation |
| Compare, CI, storage, result reports | Real storage sources, stable-task comparisons, report download | Compatible spec versions, CI/revision provenance, durable ingestion |
| Runtime progress/cancellation/retries | Artifact-derived SSE replay; explicit demo playback | Authoritative worker state, live events, authenticated run-control APIs |
The real catalog derives observed suites from results; it does not discover all installed skills. Readiness, coverage, token budgets, and git revisions remain unavailable. The synthetic catalog is illustrative only.
Local-first and cloud architecture
Section titled “Local-first and cloud architecture”Current implementation: a lazy-loaded React route with scoped light styles,
polled real-result summaries, lazy evidence loading, replayable SSE, and in-browser
exports. GET /api/v1/lab/runs refreshes local artifacts without changing classic
listing behavior. Additive API metadata includes skill, repetitions, weighted
scores, and stable task IDs. The original dashboard retains its shell, routes,
and dark theme. No new storage, authentication, or deployment resources are added.
Recommended future architecture: the same UI and versioned query/event contracts in both deployment modes, with execution separated from viewing.
flowchart LR UI["Dashboard UI"] --> API["Authenticated query / control API"] API --> META["Run metadata + query index"] API --> ART["Immutable result / trace artifacts"] API --> EVENTS["Replayable run events"] CLI["Local CLI / CI ingestion"] --> API API --> QUEUE["Execution queue"] QUEUE --> WORKER["Isolated Waza workers"] WORKER --> ART WORKER --> EVENTSLocally, preserve loopback defaults and use the existing result artifacts with a durable query index (SQLite is a candidate). In a shared cloud service, introduce identity, project authorization, durable database/object storage, and separate execution workers. Choose the cloud provider and deployment product after validating the UI and execution requirements.
Production requirements include retention, redaction, audit trails, pagination, artifact/spec revisions, stable task/run identity, retry/attempt provenance, and authoritative run states. Existing artifact-derived SSE replay is useful prior art, but must not be described as a worker queue or proof of real-time execution control. A live event contract needs sequence/resume behavior, disconnect/error states, and reconnect handling.
Hosting the mock
Section titled “Hosting the mock”npm run build produces static frontend assets. Those assets can be served by a
static host without credentials or an API for /#/lab/demo; the real lab and classic dashboard
routes still need Waza’s API. Keep the lab’s synthetic banner intact. Static
hosting demonstrates UX only, not a hosted eval service.
Build output belongs to the existing embedded dashboard pipeline. Do not commit generated hashed asset references as an incidental build change.
Verification
Section titled “Verification”cd webnpm run buildnpm run lintnpx playwright test e2e/dashboard-lab.spec.ts e2e/dashboard-lab-real.spec.ts --project=chromiumnpx playwright test e2e/screenshots.spec.ts --project=chromium --grep dashboard-labBrowser coverage exercises real summaries, arbitrary models, lazy evidence, precision, API errors/retries/refresh, stable and legacy IDs, duplicate identities, report failures, event replay/deduplication/reconnection, and the isolated demo. Go coverage checks flag selection/TCP exclusion, launch URLs, metadata mapping, storage provenance, and refreshed artifacts. Run the classic dashboard suite as well when changing shared routing or export helpers.