Task 01: Monitoring Your Prompt Flows
Description
In this task, you will create and configure a monitoring solution to track the quality and token usage of your deployed prompt flow application.
Success Criteria
- Set up monitoring for Prompt Flow
- Configure monitoring
- Consume monitoring results
Solution
01: Deploy the RAG flow with tracing enabled
In this section, you will deploy your flow again, but this time with tracing enabled.
Expand this section to view the solution
-
Delete the dist directory created during the previous deployment
rm -rf dist -
Package your flow as a Docker image. This process will create a Dockerfile for your flow.
-
Open a terminal in the root directory of your project.
-
Run the following command to build your flow and create a Docker image:
pf flow build --source src --output dist --format docker
This command packages your flow and outputs it to the dist directory in Docker format.
-
-
Enable tracing in your flow.
-
Open the following file: dist/flow/flow.flex.yaml
-
Update its content with:
app_insights_enabled: true inputs: question: type: string chat_history: type: object entry: chat_request:get_response -
Save the file.
-
-
To ensure Python can locate the modules in the flow source directory, you need to set the PYTHONPATH environment variable. In your terminal, run the following command:
export PYTHONPATH=./src:$PYTHONPATHSkipping this step will result in a ModuleNotFoundError: No module named ‘chat_request’.
Now, you’re ready to deploy your flow.
-
Open the deployment script: util/deploy_moe.py
-
Navigate to line 77 and update it with the following code to configure your flow to work with the AI Foundry Test Chat interface:
model = Model( name="ragwithtrace", path=flow_path, # path to the promptflow folder properties=[ # enables the chat interface in the endpoint test tab ["azureml.promptflow.source_flow_id", "ragwithtrace"], ["azureml.promptflow.mode", "chat"], ["azureml.promptflow.chat_input", "question"], ["azureml.promptflow.chat_output", "answer"] ] ), -
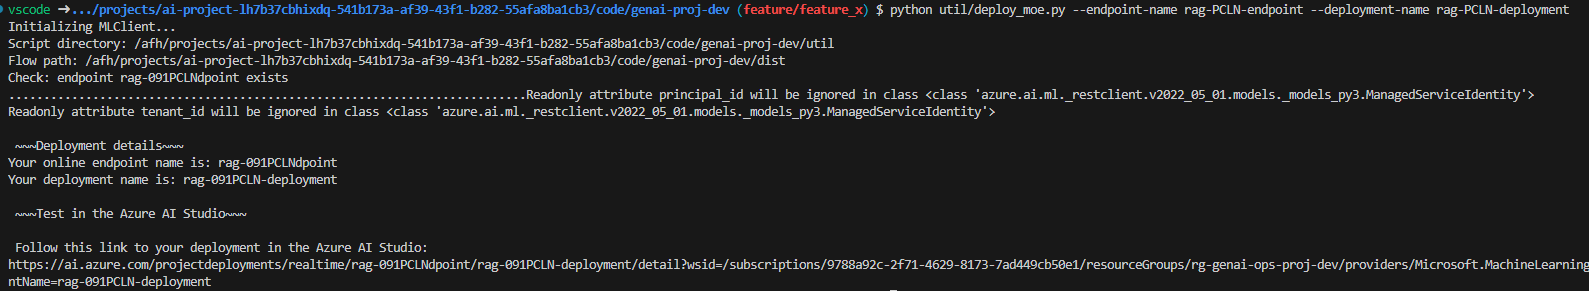
In the terminal, run the following command, replacing XXXX in both the endpoint-name and deployment-name with a unique four-digit number of your choice:
python util/deploy_moe.py --endpoint-name rag-XXXX-endpoint --deployment-name rag-XXXX-deploymentUse a different endpoint and deployment name than the one used in the previous exercise.
This may take around 20 minutes to deploy.
-
Upon completion, you should see output similar to the following in your terminal:
If you encounter the error “Key based authentication is not permitted on this storage account,” enable the Allow storage account key access option in the Configuration section of your storage account in the Azure portal.
02: Create a monitor configuration
Expand this section to view the solution
-
Create a monitor.py file in the local folder and add the following content, updating the Update your Azure resources details section with your deployment details:
from azure.ai.ml import MLClient from azure.ai.ml.entities import ( MonitorSchedule, CronTrigger, MonitorDefinition, ServerlessSparkCompute, MonitoringTarget, AlertNotification, GenerationSafetyQualityMonitoringMetricThreshold, GenerationSafetyQualitySignal, BaselineDataRange, LlmData, ) from azure.ai.ml.entities._inputs_outputs import Input from azure.ai.ml.constants import MonitorTargetTasks, MonitorDatasetContext from azure.identity import DefaultAzureCredential credential = DefaultAzureCredential() # Update your Azure resources details subscription_id = "[your_subscription_id]" resource_group = "[your_resource_group_id]" aoai_deployment_name = "gpt-4" aoai_connection_name = "aoai-connection" project_name = "[your_ai_studio_project_name]" # Ex: ai-project-lh7b37cbhixdq endpoint_name = "[your_endpoint_name]" # Ex: rag-PCLN-endpoint deployment_name = "[your_deployment_name]" # Ex: rag-PCLN-deployment # These variables can be renamed, but it's not necessary app_trace_name = "app_traces" app_trace_version = "1" monitor_name = "gen_ai_monitor_generation_quality" defaultgsqsignalname = "gsq-signal" # Set the frequency and notification emails for the monitor trigger_schedule = CronTrigger(expression="*/5 * * * *") notification_emails_list = ["test@example.com", "def@example.com"] ml_client = MLClient( credential=credential, subscription_id=subscription_id, resource_group_name=resource_group, workspace_name=project_name, ) spark_compute = ServerlessSparkCompute(instance_type="standard_e4s_v3", runtime_version="3.3") monitoring_target = MonitoringTarget( ml_task=MonitorTargetTasks.QUESTION_ANSWERING, endpoint_deployment_id=f"azureml:{endpoint_name}:{deployment_name}", ) # Set thresholds (0.7 = 70%) aggregated_groundedness_pass_rate = 0.7 aggregated_relevance_pass_rate = 0.7 aggregated_coherence_pass_rate = 0.7 aggregated_fluency_pass_rate = 0.7 # Create a Generation Safety Quality (GSQ) signal generation_quality_thresholds = GenerationSafetyQualityMonitoringMetricThreshold( groundedness={"aggregated_groundedness_pass_rate": aggregated_groundedness_pass_rate}, relevance={"aggregated_relevance_pass_rate": aggregated_relevance_pass_rate}, coherence={"aggregated_coherence_pass_rate": aggregated_coherence_pass_rate}, fluency={"aggregated_fluency_pass_rate": aggregated_fluency_pass_rate}, ) input_data = Input( type="uri_folder", path=f"{endpoint_name}-{deployment_name}-{app_trace_name}:{app_trace_version}", ) data_window = BaselineDataRange(lookback_window_size="P7D", lookback_window_offset="P0D") production_data = LlmData( data_column_names={"prompt_column": "question", "completion_column": "answer", "context_column": "context"}, input_data=input_data, data_window=data_window, ) gsq_signal = GenerationSafetyQualitySignal( connection_id=f"/subscriptions/{subscription_id}/resourceGroups/{resource_group}/providers/Microsoft.MachineLearningServices/workspaces/{project_name}/connections/{aoai_connection_name}", metric_thresholds=generation_quality_thresholds, production_data=[production_data], sampling_rate=1.0, properties={ "aoai_deployment_name": aoai_deployment_name, "enable_action_analyzer": "false", "azureml.modelmonitor.gsq_thresholds": '[{"metricName":"average_fluency","threshold":{"value":4}},{"metricName":"average_coherence","threshold":{"value":4}}]', }, ) monitoring_signals = { defaultgsqsignalname: gsq_signal, } monitor_settings = MonitorDefinition( compute=spark_compute, monitoring_target=monitoring_target, monitoring_signals=monitoring_signals, alert_notification=AlertNotification(emails=notification_emails_list), ) model_monitor = MonitorSchedule( name=monitor_name, trigger=trigger_schedule, create_monitor=monitor_settings, ) ml_client.schedules.begin_create_or_update(model_monitor) -
Now, run the monitor.py program to create your monitor configuration:
python local/monitor.py
Your monitoring configuration is now set up.
03: Send some requests to your endpoint to generate monitoring data
Expand this section to view the solution
-
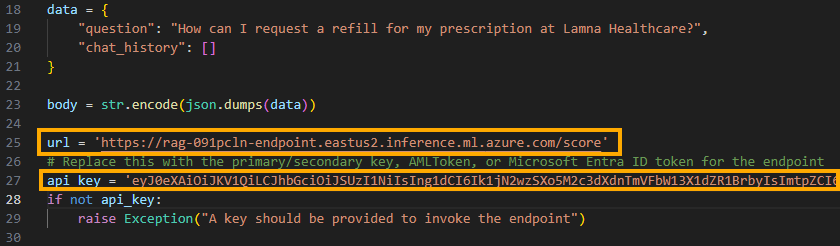
Update the local/test.py program created earlier with the new endpoint and API key
-
Save the file.
-
Run the local/test.py program multiple times to generate some requests
python local/test.py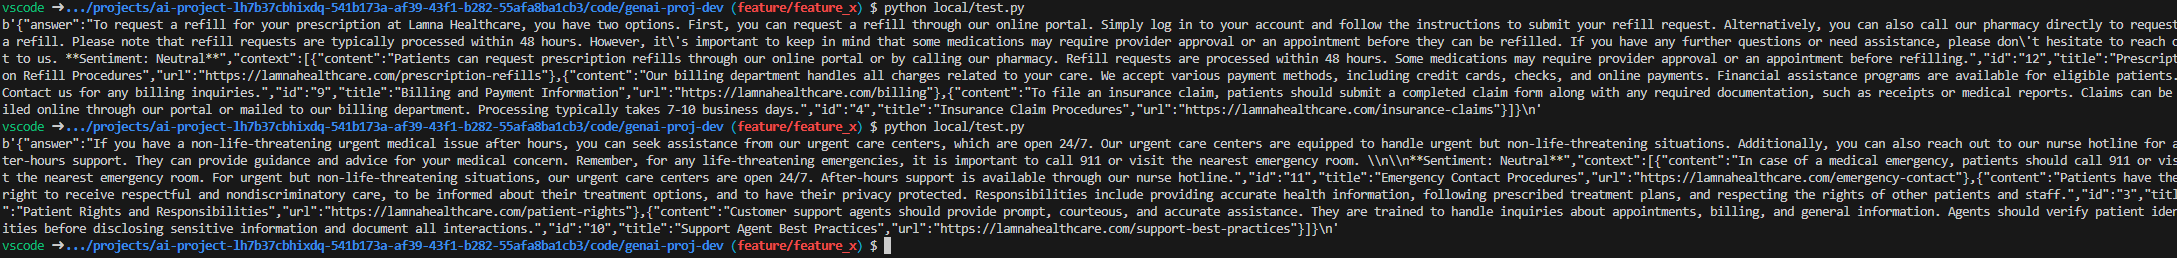
You can vary the question content for each request by modifying it on line 19 of the test.py program.
04: Consume monitoring results
Once you’ve set up your monitor, it will run accordingly the schedule you set in the monitoring configuration.
Expand this section to view the solution
-
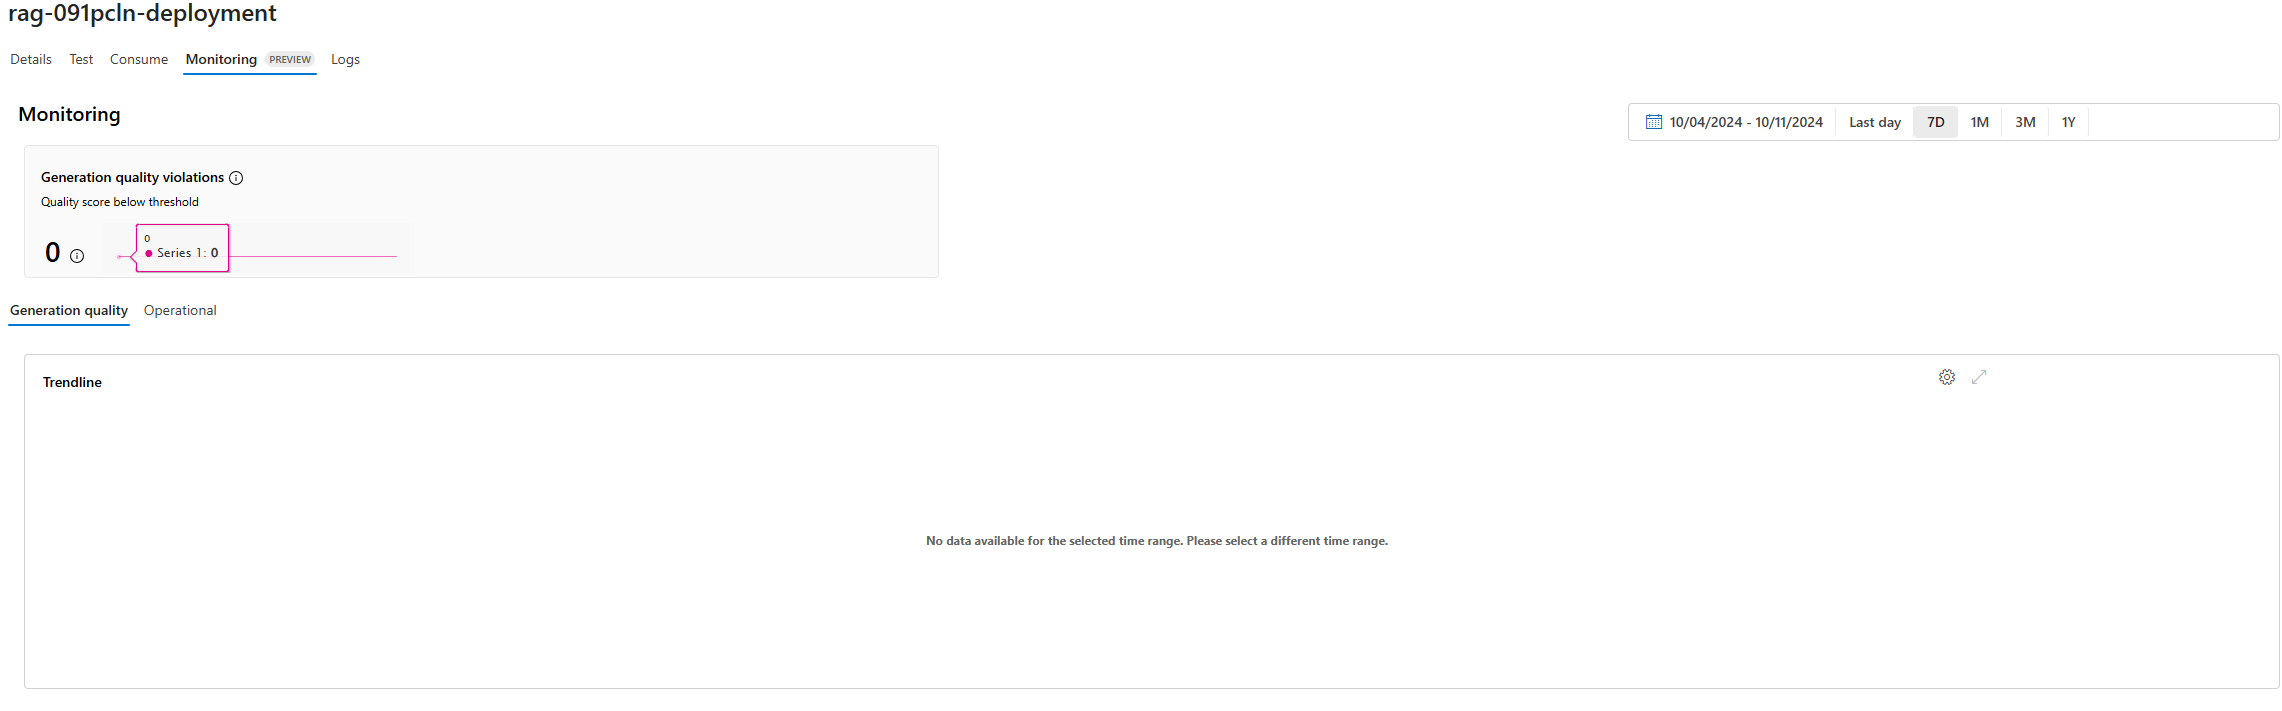
Go to the Monitoring (preview) tab within the deployment to view the monitoring results.
-
Go to the Generation quality tab to monitor the quality of your application over time. Metrics shown include:
- Violation count: Sum of violations for a given metric (e.g., Fluency) during the time window.
- Average score: Average score for all instances (or requests) over the time window.
The Generation quality violations card shows the violation rate, which is the number of violations divided by the total number of possible violations. Adjust thresholds and computation frequency (default: daily) in the settings.
-
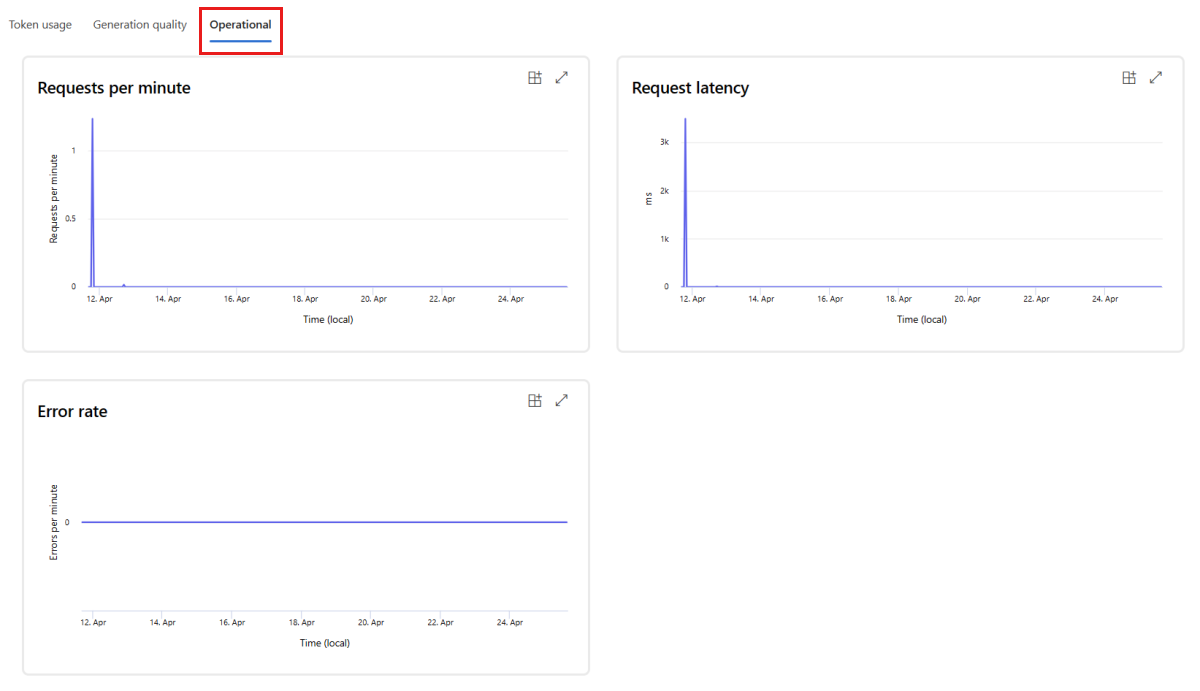
Go to the Operational tab to view near real-time operational metrics for the deployment, including:
- Request count
- Latency
- Error rate
05: Enable tracing in Application Insights
You can enable tracing in Application Insights by selecting your workspace’s Application Insights.
Expand this section to view the solution
-
Open Application Insights, select Usage and estimated costs under Configure from the left menu.
-
Select Custom metrics (Preview).
-
Select With dimensions, then select OK to save changes.
-
Select Metrics under Monitoring from the left menu.
-
Select Promptflow standard metrics from the Metric Namespace, and explore metrics using different aggregation methods.
-
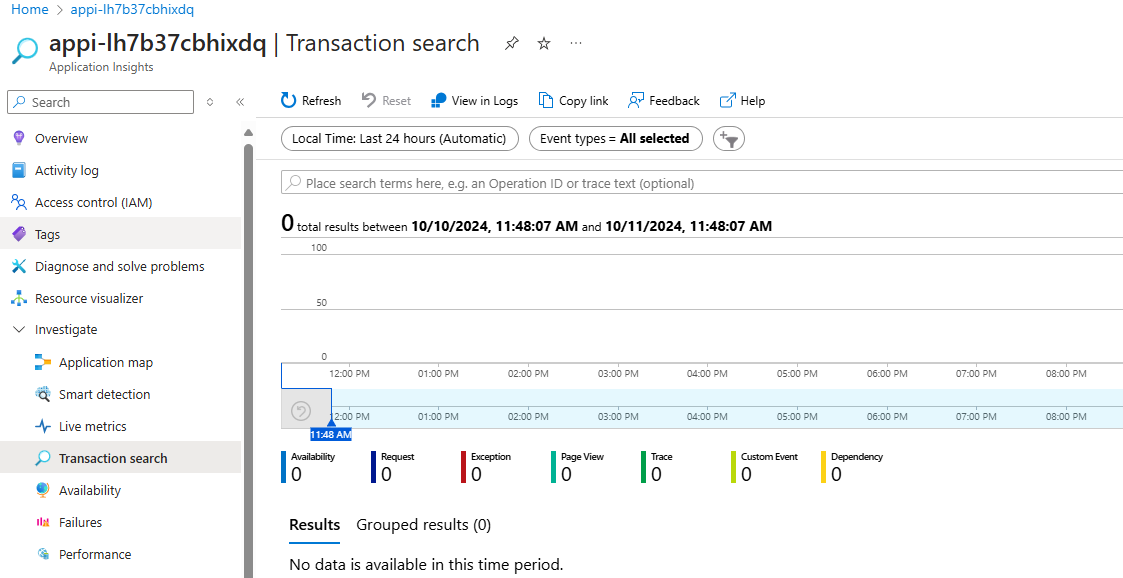
Select Transaction search from the left menu to view tracing in the transactional data.