Monitoring Azure Cosmos DB Garnet Cache
Azure Cosmos DB Garnet Cache provides comprehensive monitoring capabilities through Azure Monitor, enabling you to track performance, troubleshoot issues, and optimize your cache deployment.
Azure Monitor
Metrics
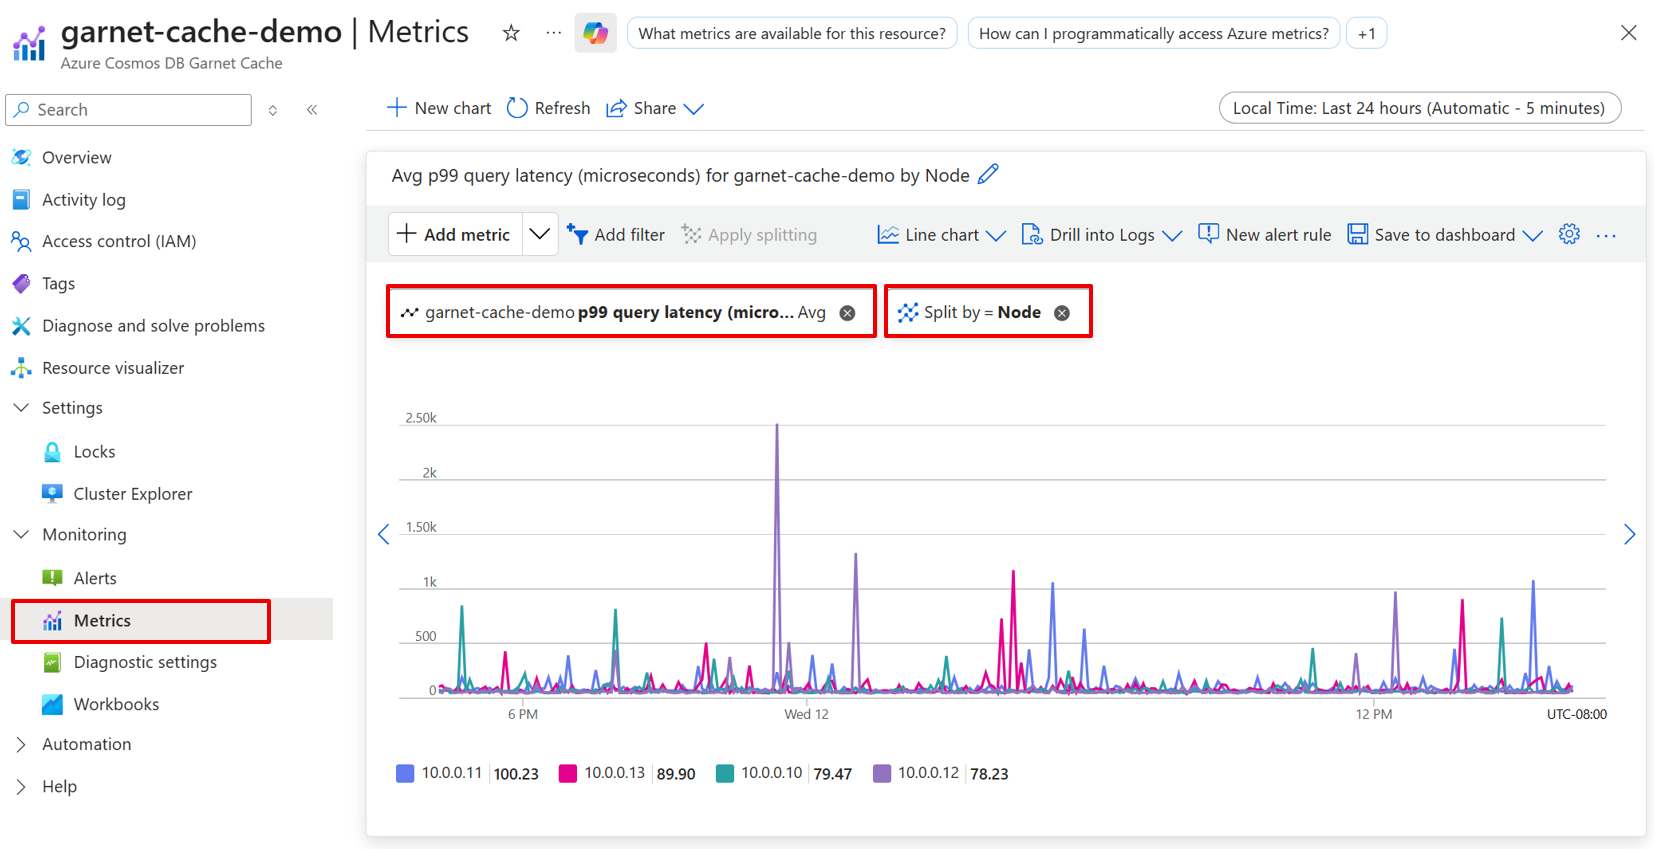
Azure Cosmos DB Garnet Cache automatically collects metrics and sends them to Azure Monitor. Most metrics have Min, Max, and Average aggregations as well as the ability to split by Node for detailed insights into cluster performance.
Garnet Client Metrics
| Metric | Additional Information |
|---|---|
| Connected Clients |
Query Performance Metrics
| Metric | Additional Information |
|---|---|
| Command Process Rate | The total number of commands processed per second. |
| Query Latency P99 | The P99 latency of processing per network call received server-side, considering only non-admin requests. Reported in microseconds. |
| Query Latency Mean | The mean latency of processing per network call received server-side, considering only non-admin requests. Reported in microseconds. |
| Read Command Process Rate | The number of read commands processed. |
| Write Command Process Rate | The number of write commands processed. |
Garnet Store Metrics
| Metric | Additional Information |
|---|---|
| Index Size | The size of the index in the main store in bytes. |
| Log Size | The size of the log in the main store in bytes. |
| Main Store Size | Total size of the main store including index, log, and overflow in bytes. |
| Read Cache Size | Size of read cache in the main store in bytes. |
System Metrics
| Metric | Additional Information |
|---|---|
| Average CPU Usage Active | Average active CPU usage across all CPUs. |
| CPU Usage Active | |
| Memory Utilization | |
| Network Received Bytes | |
| Network Received Packets | |
| Network Transmitted Bytes | |
| Network Transmitted Packets |
Activity log
The Azure Monitor activity log contains entries for control plane events from Azure Cosmos DB Garnet Cache resources. It includes information like when a cache cluster is created, when scaling operations occur, or when RBAC permissions are granted. Use the activity log to review or audit administrative actions on your Azure Cosmos DB Garnet Cache resources, or create alerts to be proactively notified when control plane events occur.
Troubleshooting Common Issues
High CPU Usage
High CPU usage can indicate various performance bottlenecks in your cluster. Use the Average CPU Usage Active and CPU Usage Active metrics to identify and resolve CPU-related issues.
Symptoms
- Average CPU Usage Active consistently above 80%.
- CPU Usage Active showing spikes during peak usage.
- Increased Query Latency P99 and Query Latency Mean values.
- Degraded Command Process Rate performance.
Resolution Steps
- Analyze Command Patterns: Review Command Process Rate trends to identify peak usage periods causing high CPU load.
- Monitor Node Distribution: Use the Node split feature to identify if specific nodes are experiencing higher CPU usage than others.
- Scale Compute Resources: Increase the shard count if Write Command Process Rate is high. To improve read throughput, provision a cluster with a higher replication factor. The replication factor is set at provisioning and can't be changed afterward.
High Memory Usage
Memory utilization issues can lead to performance degradation and potential data eviction. Monitor Memory Utilization alongside store-specific metrics to maintain optimal performance.
Symptoms
- Memory Utilization approaching or exceeding 85%.
- Main Store Size growing rapidly or unexpectedly.
- Index Size or Log Size consuming excessive memory.
- Increased cache misses or eviction events.
Resolution Steps
- Analyze Memory Distribution: Review Main Store Size, Index Size, Log Size, and Read Cache Size to identify which component is consuming the most memory.
- Implement TTL Strategies: Set appropriate time-to-live values for cached data to ensure automatic cleanup.
- Optimize Data Structures: Use more memory-efficient data types where appropriate.
- Scale Memory Resources: Consider increasing the shard count for more memory, or scale-up to a higher SKU.
Connection Issues
Connection problems can manifest through various network and client metrics. Use Connected Clients, Network Received/Transmitted Bytes, and Network Received/Transmitted Packets to diagnose connectivity issues.
Symptoms
- Connected Clients count dropping unexpectedly or remaining at zero.
- Network Received Bytes or Network Transmitted Bytes showing irregular patterns.
- Client applications reporting connection timeouts or failures.
- Inconsistent Command Process Rate despite steady application load.
Resolution Steps
- Verify Network Connectivity: Test basic network connectivity from client applications to the cache endpoint.
- Review Authentication: Verify that authentication credentials are valid and have appropriate permissions. If you recently assigned roles, wait a few minutes for the assignments to propagate.
- Monitor Connection Patterns: Analyze Connected Clients trends to identify if connection issues are intermittent or persistent.
- Review Client Configuration: Ensure client applications are using appropriate connection timeout and retry settings.
Performance Degradation
Performance issues can affect various aspects of your cache operations. Use latency and throughput metrics to identify and resolve performance bottlenecks.
Symptoms
- Query Latency P99 exceeding SLA thresholds (consistently above 3ms).
- Query Latency Mean showing consistent increases.
- Command Process Rate declining despite steady or increased demand.
- Read Command Process Rate or Write Command Process Rate not meeting expected throughput.
Resolution Steps
- Analyze Latency Patterns: Compare Query Latency P99 and Query Latency Mean to identify if performance issues are persistent.
- Check Resource Utilization: Review CPU Usage Active and Memory Utilization to identify resource constraints.
- Evaluate Network Performance: Check Network Received/Transmitted Bytes and Packets for signs of network congestion.
- Review Command Distribution: Analyze Read Command Process Rate vs Write Command Process Rate to understand workload characteristics.
- Identify Node Hotspots: Use Node-level metrics to detect if specific nodes are experiencing disproportionate load.
- Scale Appropriately: Consider upgrading to higher performance tiers or adding more nodes based on the specific bottleneck identified.
Cluster Creation or Scaling Fails
Provisioning and scaling are control plane operations governed by Azure RBAC rather than surfaced through metrics. If a cluster fails to create or scale, verify the caller's permissions.
Symptoms
- Cluster creation fails with an authorization error.
- Scaling (changing the shard count) fails with a permissions error.
Resolution Steps
- Verify cluster permissions: Ensure your identity has
Microsoft.DocumentDB/garnetClusters/writeandMicrosoft.Network/virtualNetworks/subnets/join/actionon the cluster's subnet. - Check your role: The built-in Owner and Contributor roles include both permissions. Cosmos DB-specific roles (Cosmos DB Operator, DocumentDB Account Contributor, and similar) can't create or scale a Garnet cluster.
- Update custom roles: If you use a custom role, add both actions. A role that can create networking resources doesn't necessarily include subnet
join/action. - Wait for propagation: If a role assignment was recently added, allow a few minutes for it to take effect before retrying.
See permissions to create and manage a cluster.