Debugging Scripts
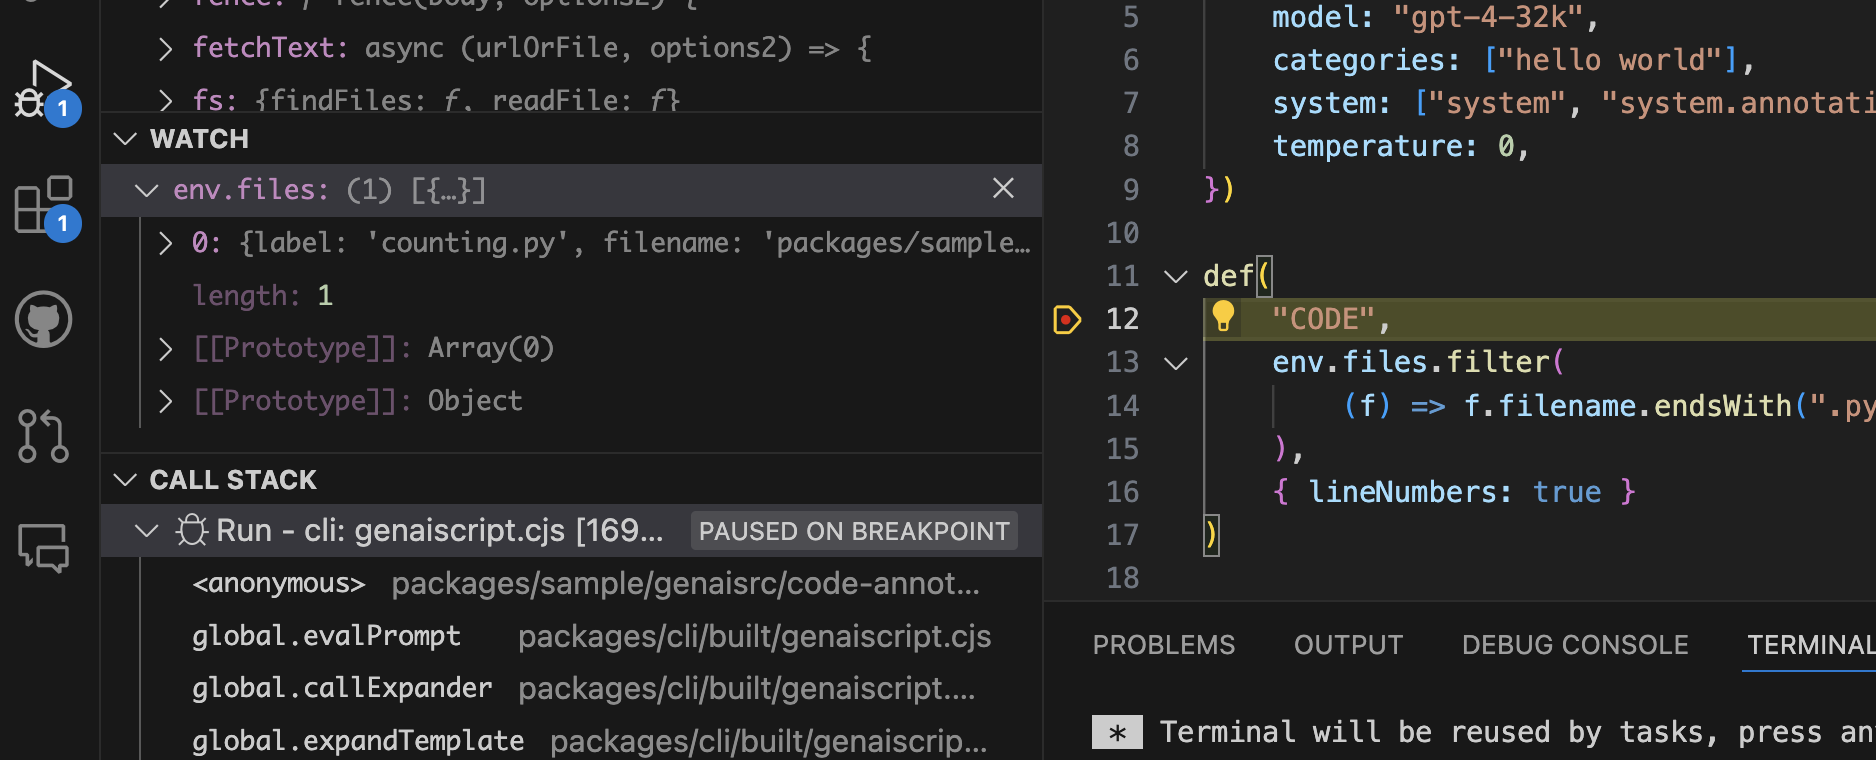
The GenAIScript script files are executable JavaScript and can be debugged using the Visual Studio Code Debugger, just like any other JavaScript program.
Starting a debugging session
Section titled “Starting a debugging session”- Open the
.genai.mjsfile to debug and add breakpoints.
From the env files
Section titled “From the env files”- Right click in the editor of the file you want in
env.files. - Select the GenAIScript from the picker.
From the script itself
Section titled “From the script itself”- Add a
filesfield in thescriptfunction
script({ ..., files: "*.md"})- Click on the Debug icon button on the editor menu (hidden under the run button).
The debugger will launch the cli and run the script in debug mode. The debugger will stop at the breakpoints you set.
Limitations
Section titled “Limitations”The JavaScript executes in an external node process. Therefore,
- The trace preview and output is not supported while debugging.
Next steps
Section titled “Next steps”Keep iterating the script or add tests.