User interface
Device Explorer
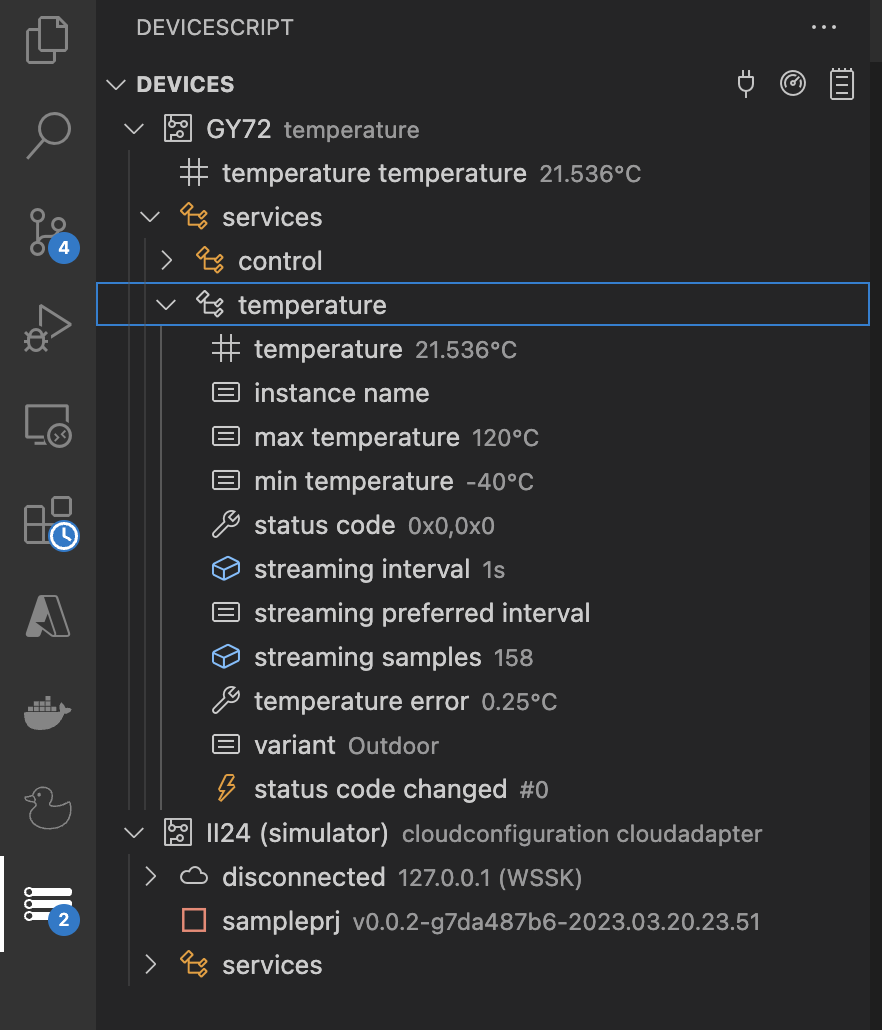
The DeviceScript view is opened by clicking the DeviceScript logo in the left bar menu.
It provides a treeview of the device, services, registers and events. The tree view updates automatically with live data from the simulators and devices.
Device Explorer Actions
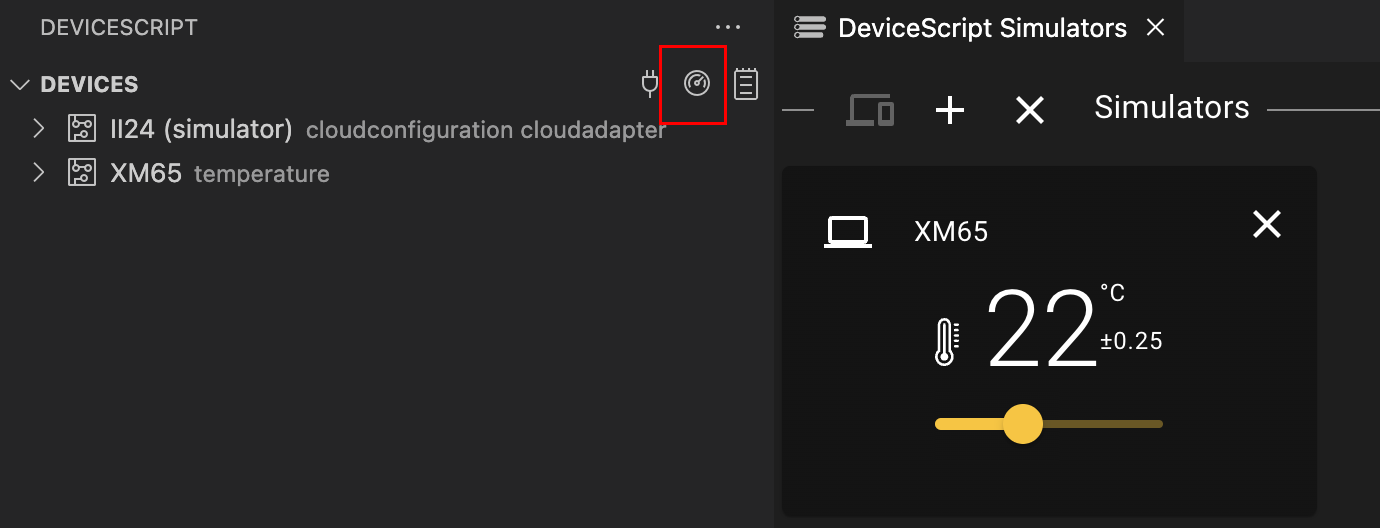
The view has 3 actions:
connect, the plug icon, which allows you to connect to a physical device, start the simulator or flash new firmware.dashboard, starts the peripheral simulator dashboardterminal, displays the DeviceScript terminal
Register and Events watch
You can watch any register or event in the device explorer. This provides a way to 'pin' a register for debugging or monitoring.
Editor title actions
Any main*.ts file in a DeviceScript project will have added action in the editor title.
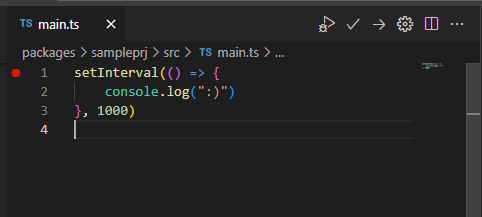
Debug: starts a debugging session from this file,Build: builds the binary for this entry point file,Upload: builds and deploys the binary to the current deviceConfigure: a wizard experience that helps you configure the code for your hardware device
Terminal
The DeviceScript terminal displays the status of the development tool process and the console output from devices.
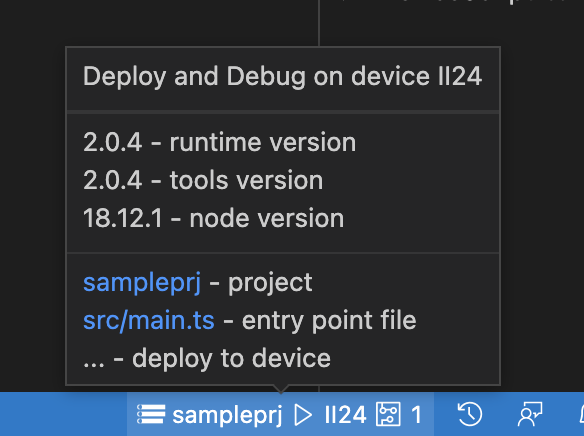
Status bar
The DeviceScript status shows a logo and the current project name (the extension works on a single project at a time). You can hover over the status to get more information or click to change the current project.