This page was generated from
docs/examples/driver_examples/QCoDeS Example with Yokogawa GS200 and Keithley 7510.ipynb.
Interactive online version:
![]() .
.
QCoDeS Example with Yokogawa GS200 and Keithley 7510 Multimeter
In this example, we will show how to use the Yokogawa GS200 smu and keithley 7510 dmm to perform a sweep measurement. The GS200 smu will source current through a 10 Ohm resistor using the program feature, and trigger the the 7510 dmm, which will measure the voltage across the resistor by digitize function.
[1]:
import time

import matplotlib.pyplot as plt

from qcodes.dataset import Measurement, plot_dataset
from qcodes.instrument_drivers.Keithley import Keithley7510
from qcodes.instrument_drivers.yokogawa import YokogawaGS200
[2]:
gs = YokogawaGS200("gs200", "USB0::0x0B21::0x0039::91W434594::INSTR")
dmm = Keithley7510("dmm_7510", "USB0::0x05E6::0x7510::04450961::INSTR")
Connected to: YOKOGAWA GS210 (serial:91W434594, firmware:2.02) in 0.06s
Connected to: KEITHLEY INSTRUMENTS DMM7510 (serial:04450961, firmware:1.6.7d) in 0.04s
[3]:
gs.reset()
dmm.reset()
1. GS200 setup
To set the source mode to be “current” (by default it’s “votage”), and set the current range and votlage limit.
[4]:
gs.source_mode("CURR")
gs.current(0)
gs.current_range(0.01)
gs.voltage_limit(5)
By default, the output should be off:
[5]:
gs.output()
[5]:
'off'
1.1 Trigger Settings
The BNC port will be use for triggering out. There are three different settings for trigger out signal:
Trigger (default)
This pin transmits the TrigBusy signal. A low-level signal upon trigger generation and a high-level signal upon source operation completion.
Output
This pin transmits the output state. A high-level signal if the output is off and a lowlevel signal if the output is on.
Ready
This pin transmits the source change completion signal (Ready). This is transmitted 10 ms after the source level changes as a low pulse with a width of 10 μs.
[6]:
print(f'By default, the setting for BNC trigger out is "{gs.BNC_out()}".')
By default, the setting for BNC trigger out is "TRIG".
1.2 Program the sweep
The GS200 does not have a build-in “sweep” function, but the “program” feature can generate a source data pattern that user specified as a program in advance.
The following is a simple program, in which the current changes first to 0.01A, then -0.01A, and returns to 0A:
[7]:
gs.program.start()  # Starts program memory editing
gs.current(0.01)
gs.current(-0.01)
gs.current(0.0)
gs.program.end()  # Ends program memory editing
It can be save to the system memory (memory of the GS200):
[8]:
gs.program.save("test1_up_and_down.csv")
The advantage of saving to the memory is that the user can have multiple patterns stored:
[9]:
gs.program.start()  # Starts program memory editing
gs.current(0.01)
gs.current(-0.01)
gs.current(0.005)
gs.current(0.0)
gs.program.end()  # Ends program memory editing
[10]:
gs.program.save("test2_up_down_up.csv")
Let’s load the first one:
[11]:
gs.program.load("test1_up_and_down.csv")
The interval time between each value is set as following:
[12]:
gs.program.interval(0.1)
print(f"The interval time is {float(gs.program.interval())} s")
The interval time is 0.1 s
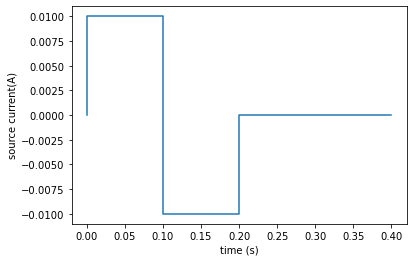
By default, the change is instant, so the output would be like the following:
[13]:
t_axis = [0, 0, 0.1, 0.1, 0.2, 0.2, 0.3, 0.4]
curr_axis = [0, 0.01, 0.01, -0.01, -0.01, 0, 0, 0]
plt.plot(t_axis, curr_axis)
plt.xlabel("time (s)")
plt.ylabel("source current(A)")
[13]:
Text(0, 0.5, 'source current(A)')
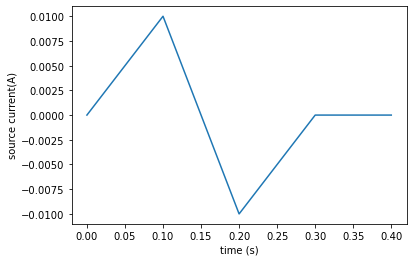
But we want to introduce a “slope” between each source values: (see the user’s manual for more examples of the “slope time”)
[14]:
gs.program.slope(0.1)
print(f"The slope time is {float(gs.program.slope())} s")
The slope time is 0.1 s
As a result, the expected output current will be:
[15]:
t_axis = [0, 0.1, 0.2, 0.3, 0.4]
curr_axis = [0, 0.01, -0.01, 0, 0]
plt.plot(t_axis, curr_axis)
plt.xlabel("time (s)")
plt.ylabel("source current(A)")
[15]:
Text(0, 0.5, 'source current(A)')
By default, the GS200 will keep repeating this pattern once it starts:
[16]:
gs.program.repeat()
[16]:
'ON'
We only want it to generate the pattern once:
[17]:
gs.program.repeat("OFF")
print(f"The program repetition mode is now {gs.program.repeat()}.")
The program repetition mode is now OFF.
Note: at this moment, the output of the GS200 should still be off:
[18]:
gs.output()
[18]:
'off'
2. Keithley 7510 Setup
2.1 Setup basic digitize mode
The DMM7510 digitize functions make fast, predictably spaced measurements. The speed, sensitivity, and bandwidth of the digitize functions allows you to make accurate voltage and current readings of fast signals, such as those associated with sensors, audio, medical devices, power line issues, and industrial processes. The digitize functions can provide 1,000,000 readings per second at 4½ digits.
To set the digitize function to measure voltage, and the range.
[19]:
dmm.digi_sense_function("voltage")
dmm.digi_sense.range(10)
The system will determines when the 10 MΩ input divider is enabled: (for voltage measurement only)
[20]:
dmm.digi_sense.input_impedance("AUTO")
To define the precise acquisition rate at which the digitizing measurements are made: (this is for digitize mode only)
[21]:
readings_per_second = 10000
dmm.digi_sense.acq_rate(readings_per_second)
print(
    f"The acquisition rate is {dmm.digi_sense.acq_rate()} digitizing measurements per second."
)
The acquisition rate is 10000 digitizing measurements per second.
We will let the system to decide the aperture size:
[22]:
dmm.digi_sense.aperture("AUTO")
We also need to tell the instrument how many readings will be recorded:
[23]:
number_of_readings = 4000
dmm.digi_sense.count(number_of_readings)
print(
    f"{dmm.digi_sense.count()} measurements will be made every time the digitize function is triggered."
)
4000 measurements will be made every time the digitize function is triggered.
2.2 Use an user buffer to store the data
[24]:
buffer_name = "userbuff01"
buffer_size = 100000
buffer = dmm.buffer(buffer_name, buffer_size)
[25]:
print(
    f'The user buffer "{buffer.short_name}" can store {buffer.size()} readings, which is more than enough for this example.'
)
The user buffer "userbuff01" can store 100000 readings, which is more than enough for this example.
One of the benefits of using a larger size is: base on the settings above, the GS200 will send more than one trigger to the 7510. Technically, once a trigger is received, the 7510 unit would ignore any other trigger until it returns to idle. However, in reality it may still response to more than the first trigger. A large size will prevent the data in the buffer from being overwritten.
[26]:
print(
    f"There are {buffer.last_index() - buffer.first_index()} readings in the buffer at this moment."
)
There are 0 readings in the buffer at this moment.
2.3 Setup the tigger in
By default, the falling edge will be used to trigger the measurement:
[27]:
dmm.trigger_in_ext_edge()
[27]:
'FALL'
[28]:
dmm.digitize_trigger()
[28]:
'NONE'
We want an external trigger to trigger the measurement:
[29]:
dmm.digitize_trigger("external")
dmm.digitize_trigger()
[29]:
'EXT'
3. Check for errors
[30]:
while True:
    smu_error = gs.system_errors()
    if "No error" in smu_error:
        break
    print(smu_error)
[31]:
while True:
    dmm_error = dmm.system_errors()
    if "No error" in dmm_error:
        break
    print(dmm_error)
4. Make the measurement
To clear the external trigger in, and clear the buffer:
[32]:
dmm.trigger_in_ext_clear()
buffer.clear_buffer()
[33]:
total_data_points = int(buffer.number_of_readings())
print(
    f'There are total {total_data_points} readings in the buffer "{buffer.short_name}".'
)
There are total 0 readings in the buffer "userbuff01".
Perform the measurement by turning the GS200 on and run the program:
[34]:
sleep_time = 1  # a sleep time is required, or the GS200 will turn off right away, and won't run the whole program
with gs.output.set_to("on"):
    gs.program.run()
    time.sleep(sleep_time)
The GS200 should be off after running:
[35]:
gs.output()
[35]:
'off'
[36]:
total_data_points = int(buffer.number_of_readings())
print(
    f"There are {total_data_points} readings in total, so the measurement was performed {round(total_data_points / 4000, 2)} times."
)
There are 8000 readings in total, so the measurement was performed 2.0 times.
Let’s use a time series as the setpoints:
[37]:
dt = 1 / readings_per_second
t0 = 0
t1 = (total_data_points - 1) * dt
[38]:
buffer.set_setpoints(
    start=buffer.t_start, stop=buffer.t_stop, label="time"
)  # "label" will be used for setpoints name
buffer.t_start(t0)
buffer.t_stop(t1)
To set number of points by specifying the “data_start” point and “data_end” point for the buffer:
[39]:
buffer.data_start(1)
buffer.data_end(total_data_points)
“n_pts” is read only:
[40]:
buffer.n_pts()
[40]:
8000
The setpoints:
[41]:
buffer.setpoints()
[41]:
array([0.000e+00, 1.000e-04, 2.000e-04, ..., 7.997e-01, 7.998e-01,
       7.999e-01])
The following are the available elements that saved to the buffer:
[42]:
buffer.available_elements
[42]:
{'date',
 'fractional_seconds',
 'measurement',
 'measurement_formatted',
 'measurement_status',
 'measurement_unit',
 'relative_time',
 'seconds',
 'time',
 'timestamp'}
User can select multiple ones:
[43]:
buffer.elements(["measurement", "relative_time"])
buffer.elements()
[43]:
['measurement', 'relative_time']
[44]:
meas = Measurement()
meas.register_parameter(buffer.data)

with meas.run() as datasaver:
    data = buffer.data
    datasaver.add_result((buffer.data, data()))

    dataid = datasaver.run_id
Starting experimental run with id: 167.
[45]:
plot_dataset(datasaver.dataset)
[45]:
([<matplotlib.axes._subplots.AxesSubplot at 0x21cbfeafac8>,
  <matplotlib.axes._subplots.AxesSubplot at 0x21cbfeb0ac8>],
 [None, None])
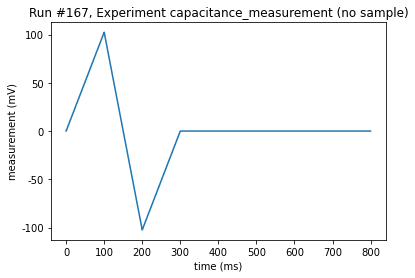

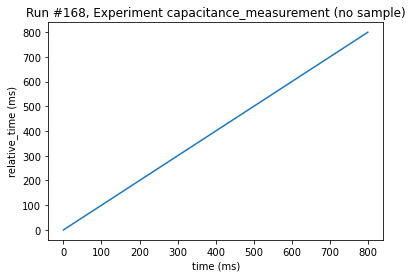
(The second plot is t-t plot so a straight line.)
[46]:
dataset = datasaver.dataset
dataset.get_parameter_data()
[46]:
{'measurement': {'measurement': array([ 3.030930e-06,  6.061867e-06,  2.273203e-04, ..., -7.226490e-12,
         -1.515476e-06, -6.061881e-06]),
  'time': array([0.000e+00, 1.000e-04, 2.000e-04, ..., 7.997e-01, 7.998e-01,
         7.999e-01])},
 'relative_time': {'relative_time': array([0.000000e+00, 1.000010e-04, 2.000020e-04, ..., 7.997029e-01,
         7.998029e-01, 7.999029e-01]),
  'time': array([0.000e+00, 1.000e-04, 2.000e-04, ..., 7.997e-01, 7.998e-01,
         7.999e-01])}}
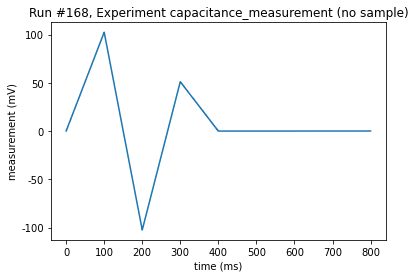
Load previously saved pattern (GS200)
Remember we had another pattern stored? Let’s load that one:
[47]:
gs.program.load("test2_up_down_up.csv")
Alwasy clear the buffer, and external trigger in for the dmm, at the beginning of each measurement:
[48]:
dmm.trigger_in_ext_clear()
buffer.clear_buffer()
[49]:
total_data_points = int(buffer.number_of_readings())
print(f'There are {total_data_points} readings in the buffer "{buffer.short_name}".')
There are 0 readings in the buffer "userbuff01".
[50]:
sleep_time = 1
with gs.output.set_to("on"):
    gs.program.run()
    time.sleep(sleep_time)
[51]:
total_data_points = int(buffer.number_of_readings())
print(
    f"There are {total_data_points} readings in total, so the measurement was performed {round(total_data_points / 4000, 2)} times."
)
There are 8000 readings in total, so the measurement was performed 2.0 times.
[52]:
buffer.elements()
[52]:
['measurement', 'relative_time']
[53]:
meas = Measurement()
meas.register_parameter(buffer.data)

with meas.run() as datasaver:
    data = buffer.data
    datasaver.add_result((buffer.data, data()))

    dataid = datasaver.run_id
Starting experimental run with id: 168.
[54]:
plot_dataset(datasaver.dataset)
[54]:
([<matplotlib.axes._subplots.AxesSubplot at 0x21cc01f0dc8>,
  <matplotlib.axes._subplots.AxesSubplot at 0x21cc01ed388>],
 [None, None])
Some of the available elements are not numerical values, for example, “timestamp”:
[55]:
buffer.elements(["timestamp", "measurement"])
buffer.elements()
[55]:
['timestamp', 'measurement']
[56]:
meas = Measurement()
meas.register_parameter(
    buffer.data, paramtype="array"
)  # remember to set paramtype="array"
[56]:
<qcodes.dataset.measurements.Measurement at 0x21cc17c0288>
[57]:
with meas.run() as datasaver:
    data = buffer.data
    datasaver.add_result((buffer.data, data()))

    dataid = datasaver.run_id
Starting experimental run with id: 169.
[58]:
datasaver.dataset.get_parameter_data()
[58]:
{'measurement': {'measurement': array([[-1.363910e-05,  1.363921e-05,  1.970109e-04, ...,  3.485577e-05,
           4.394858e-05,  3.637124e-05]]),
  'time': array([[0.000e+00, 1.000e-04, 2.000e-04, ..., 7.997e-01, 7.998e-01,
          7.999e-01]])},
 'timestamp': {'timestamp': array([['10/22/2020 07:02:50.876712500', '10/22/2020 07:02:50.876812501',
          '10/22/2020 07:02:50.876912502', ...,
          '10/22/2020 07:02:51.676415373', '10/22/2020 07:02:51.676515374',
          '10/22/2020 07:02:51.676615375']], dtype='<U29'),
  'time': array([[0.000e+00, 1.000e-04, 2.000e-04, ..., 7.997e-01, 7.998e-01,
          7.999e-01]])}}
[59]:
gs.reset()
dmm.reset()
[ ]: