This page was generated from
docs/examples/driver_examples/Qcodes example with Keysight Network Analyzer.ipynb.
Interactive online version:
![]() .
.
QCoDeS Example with Keysight Network Analyzers
This notebook is intended to give an overview over the functions implemented in the QCoDeS driver for the Keysight network analyzers. The driver is implemented to be generic as possible, with individual instrument drivers filling in only the hardware limits of the instrument, so although this example uses the N5245A, the concepts and code should work for any Keysight network analyzer.
[1]:
%matplotlib inline
[2]:
# Import Dependencies

import logging

# qcodes imports
from qcodes.dataset import (
    Measurement,
    load_experiment_by_name,
    new_experiment,
    plot_by_id,
)
from qcodes.instrument_drivers.Keysight import KeysightN5245A

# setup
logger = logging.getLogger()
logger.setLevel(logging.DEBUG)

# Start experiment
exp_name = "PNA_Example"
sample_name = "Thru_Coax"
try:
    exp = load_experiment_by_name(exp_name, sample=sample_name)
    print("Experiment loaded. Last ID no:", exp.last_counter)
except ValueError:
    exp = new_experiment(exp_name, sample_name)
    print("Starting new experiment.")
Experiment loaded. Last ID no: 16
Connect to the instrument
You will have to insert the correct VISA address for your PNA below. On my PC, the PNA has IP address 192.168.0.10. You can generally use NI MAX or Agilent IO Toolkit to figure out what the VISA address of your instrument is, particularly for USB or GPIB connections.
[3]:
pna = KeysightN5245A("pna", "TCPIP::192.168.0.10::inst0::INSTR")
Connected to: Agilent Technologies N5245A (serial:MY52451750, firmware:A.10.49.08) in 0.21s
Simple Measurements
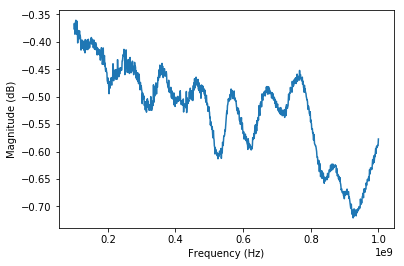
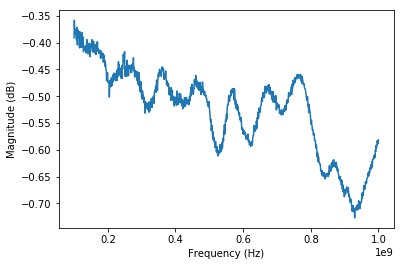
We can very easily set up measurements and pull, for example, magnitude data off the PNA.
[4]:
# Set up a frequency sweep from 100 MHz to 1 GHz, with 1001 points, at a power of -40dBm
pna.power(-40)
pna.start(100e6)
pna.stop(1e9)
pna.points(1001)
pna.trace("S21")

# Enable 2 averages, and set IF BW to 1kHz
pna.if_bandwidth(1e3)
pna.averages_enabled(True)
pna.averages(2)

# Run a measurement
meas = Measurement()
meas.register_parameter(pna.magnitude)

with meas.run() as datasaver:
    mag = pna.magnitude()
    datasaver.add_result((pna.magnitude, mag))
    dataid = datasaver.run_id
plot_by_id(dataid)

# Other valid parameter types are:
# pna.linear_magnitude()
# pna.phase()
# pna.unwrapped_phase()
# pna.group_delay()
# pna.real()
# pna.imaginary()
Starting experimental run with id: 17
[4]:
([<matplotlib.axes._subplots.AxesSubplot at 0x1ba0bf174a8>], [None])
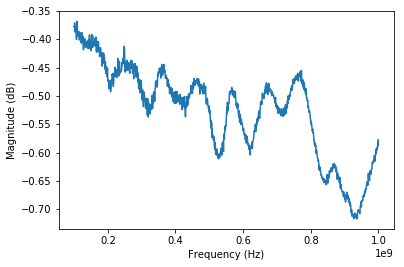
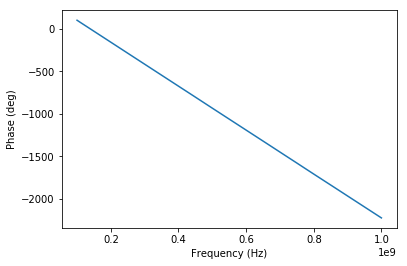
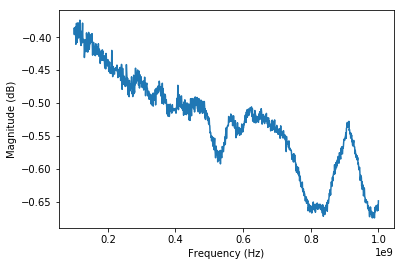
Reading multiple parameters in one measurement
If we want to read out multiple parameters in a single loop, we can disable auto-sweep and manually tell the PNA to take new data for each setpoint. Otherwise, each time we get a measured parameter of the PNA (e.g. magnitude and phase) a new trace will be taken.
[5]:
# Disable automatic sweeping
pna.auto_sweep(False)

# Run a measurement
meas = Measurement()
meas.register_parameter(pna.magnitude)
meas.register_parameter(pna.phase)

with meas.run() as datasaver:
    pna.traces.tr1.run_sweep()  # Ask the PNA to take a measurement
    mag = pna.magnitude()
    phase = pna.unwrapped_phase()
    datasaver.add_result((pna.magnitude, mag), (pna.phase, phase))
    dataid = datasaver.run_id
plot_by_id(dataid)
Starting experimental run with id: 18
[5]:
([<matplotlib.axes._subplots.AxesSubplot at 0x1ba0d6cab00>,
  <matplotlib.axes._subplots.AxesSubplot at 0x1ba0e6fe668>],
 [None, None])
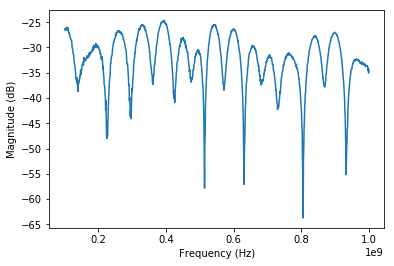
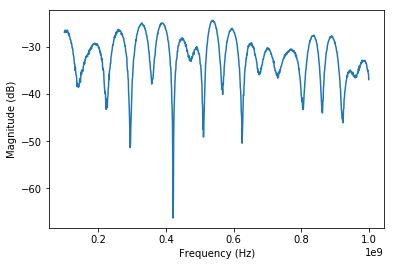
Multiple Traces
We can also read multiple traces off the PNA at once. For example if the PNA is set up such that:
Trace 1 is S11
Trace 2 is S12
Trace 3 is S21
Trace 4 is S22
we can read these off simultaneously as follows:
[7]:
# Disable automatic sweeping
pna.auto_sweep(False)

# Update the list of traces
traces = pna.traces

# Run a measurement
meas = Measurement()
meas.register_parameter(traces.tr1.magnitude)
meas.register_parameter(traces.tr2.magnitude)
meas.register_parameter(traces.tr3.magnitude)
meas.register_parameter(traces.tr4.magnitude)

with meas.run() as datasaver:
    traces.tr1.run_sweep()  # Ask the PNA to take a measurement
    data = []
    for trace in traces:
        mag = trace.magnitude()
        data.append((trace.magnitude, mag))
    datasaver.add_result(*data)
    dataid = datasaver.run_id
plot_by_id(dataid)
Starting experimental run with id: 20
[7]:
([<matplotlib.axes._subplots.AxesSubplot at 0x1ba0d6aca58>,
  <matplotlib.axes._subplots.AxesSubplot at 0x1ba0e9b90f0>,
  <matplotlib.axes._subplots.AxesSubplot at 0x1ba0e976a90>,
  <matplotlib.axes._subplots.AxesSubplot at 0x1ba0e8b3470>],
 [None, None, None, None])
[8]:
# Set the PNA back into continuous sweep mode
pna.sweep_mode("CONT")
[ ]: