This page was generated from
docs/examples/driver_examples/Qcodes-example-with-Signal-Hound-USB-SA124B-ParameterWithSetpoints.ipynb.
Interactive online version:
![]() .
.
QCoDeS Example with Signal Hound USB-SA124B ParameterWithSetpoints
This example build on top of the example in Qcodes example with Signal Hound USB-SA124B.ipynb and shows how this driver can be used with a ParameterWithSetpoints
[1]:
[2]:
from qcodes.dataset import Measurement, plot_by_id
from qcodes.instrument_drivers.signal_hound import SignalHoundUSBSA124B
[3]:
mysa = SignalHoundUSBSA124B(
    "mysa", dll_path="C:\\Program Files\\Signal Hound\\Spike\\sa_api.dll"
)
Connected to: Signal Hound sa124B (serial:17172185, firmware:Version 3.13) in 6.19s
[4]:
mysa.get_idn()
[4]:
{'vendor': 'Signal Hound',
 'model': 'sa124B',
 'serial': '17172185',
 'firmware': 'Version 3.13'}
[5]:
mysa.frequency(2e9)
mysa.span(0.5e6)
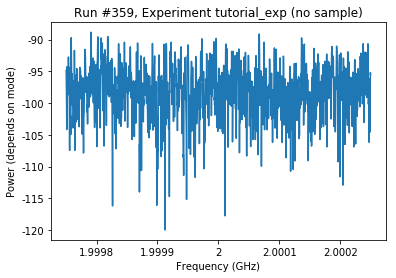
[6]:
mysa.avg(1)
meas = Measurement()
meas.register_parameter(mysa.freq_sweep)
with meas.run() as datasaver:
    datasaver.add_result(
        (mysa.frequency_axis, mysa.frequency_axis.get()),
        (
            mysa.freq_sweep,
            mysa.freq_sweep.get(),
        ),
    )

    dataid = datasaver.run_id
plot_by_id(dataid)
Starting experimental run with id: 359
[6]:
([<matplotlib.axes._subplots.AxesSubplot at 0x23d0ac3ed30>], [None])
[7]:
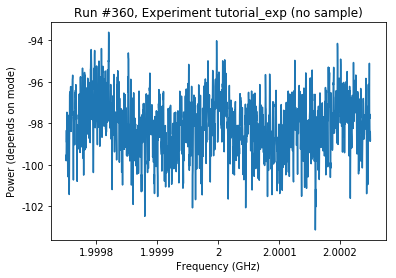
mysa.avg(10)
meas = Measurement()
meas.register_parameter(mysa.freq_sweep)
with meas.run() as datasaver:
    datasaver.add_result(
        (mysa.frequency_axis, mysa.frequency_axis.get()),
        (
            mysa.freq_sweep,
            mysa.freq_sweep.get(),
        ),
    )

    dataid = datasaver.run_id
plot_by_id(dataid)
Starting experimental run with id: 360
[7]:
([<matplotlib.axes._subplots.AxesSubplot at 0x23d0ac4f9b0>], [None])
[8]:
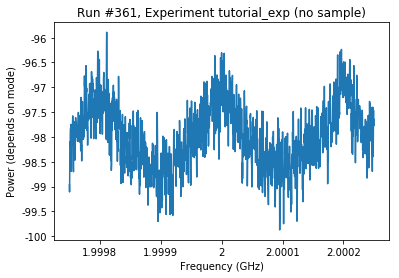
mysa.avg(100)
meas = Measurement()
meas.register_parameter(mysa.freq_sweep)
with meas.run() as datasaver:
    datasaver.add_result(
        (mysa.frequency_axis, mysa.frequency_axis.get()),
        (
            mysa.freq_sweep,
            mysa.freq_sweep.get(),
        ),
    )

    dataid = datasaver.run_id
plot_by_id(dataid)
Starting experimental run with id: 361
[8]:
([<matplotlib.axes._subplots.AxesSubplot at 0x23d0ac4f2e8>], [None])
[9]:
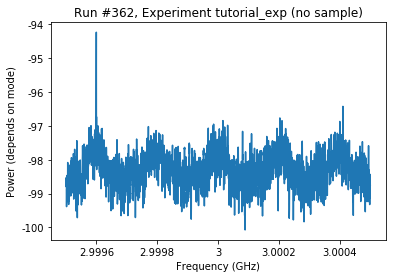
mysa.frequency(3e9)
mysa.span(1e6)
meas = Measurement()
meas.register_parameter(mysa.freq_sweep)
with meas.run() as datasaver:
    datasaver.add_result(
        (mysa.frequency_axis, mysa.frequency_axis.get()),
        (
            mysa.freq_sweep,
            mysa.freq_sweep.get(),
        ),
    )
    dataid = datasaver.run_id
plot_by_id(dataid)
Starting experimental run with id: 362
[9]:
([<matplotlib.axes._subplots.AxesSubplot at 0x23d0c1ab4a8>], [None])
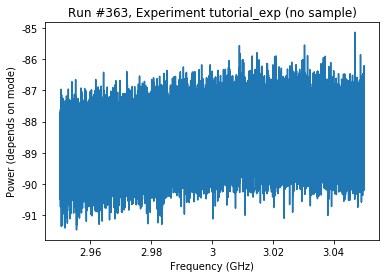
[10]:
mysa.frequency(3e9)
mysa.span(1e8)
meas = Measurement()
meas.register_parameter(mysa.freq_sweep)
with meas.run() as datasaver:
    datasaver.add_result(
        (mysa.frequency_axis, mysa.frequency_axis.get()),
        (
            mysa.freq_sweep,
            mysa.freq_sweep.get(),
        ),
    )
    dataid = datasaver.run_id
plot_by_id(dataid)
Starting experimental run with id: 363
During call of saInitiate the followingWarning: saBandwidthClamped was raised
[10]:
([<matplotlib.axes._subplots.AxesSubplot at 0x23d0c1a92b0>], [None])
[11]:
mysa.close()