This page was generated from
docs/examples/Parameters/Simple-Example-of-ParameterWithSetpoints.ipynb.
Interactive online version:
![]() .
.
Simple Example of ParameterWithSetpoints
This notebook provides an example for writing a simple driver with a parameter that has setpoints. Let’s name this parameter that has setpoints as “y”. Then, the setpoints, say “x1, x2, x3 ..”, are the parameters on which the parameter “y” depends upon. Meaning “y” is a function of “x1, x2, x3 …” where “x1, x2, x3 …” are known as the setpoints of parameter “y”.
This is most likely to be useful for instruments that return arrays of results. In this notebook, we will show an example of this.
[1]:
from pathlib import Path

import numpy as np
[2]:
from qcodes.dataset import Measurement, plot_dataset
from qcodes.instrument import Instrument
from qcodes.validators import Arrays, Numbers
[3]:
from qcodes.dataset import initialise_or_create_database_at, load_or_create_experiment
[4]:
from qcodes.parameters import Parameter, ParameterWithSetpoints
First, we define a dummy instrument that returns something like a frequency spectrum starting from a frequency given by f_start to a frequency given by f_stop in n_points steps.
The extra functionality of the ParameterWithSetpoints is implemented by giving it a reference to one or more parameters that acts like its setpoints.
To setup a ParameterWithSetpoints we have to do two things in addition to what we do for a normal parameter.
Define one or more parameter for the setpoints (one for each dimension of the array and let the
ParameterWithSetpointsknow that these are the setpoints.Give both the setpoints parameter(s) and the
ParameterWithSetpointsavalidatorof typeArrayswith a shape. The shapes should be such that the combined shape of the setpoints matches the shape of theParameterWithSetpoints. Note that if the shape changes with the setting of the instrument, it can be defined by another parameter as shown below.
[5]:
class GeneratedSetPoints(Parameter):
    """
    A parameter that generates a setpoint array from start, stop and num points
    parameters.
    """

    def __init__(self, startparam, stopparam, numpointsparam, *args, **kwargs):
        super().__init__(*args, **kwargs)
        self._startparam = startparam
        self._stopparam = stopparam
        self._numpointsparam = numpointsparam

    def get_raw(self):
        return np.linspace(
            self._startparam(), self._stopparam(), self._numpointsparam()
        )


class DummyArray(ParameterWithSetpoints):
    def get_raw(self):
        npoints = self.root_instrument.n_points.get_latest()
        return np.random.default_rng().random(npoints)


class DummySpectrumAnalyzer(Instrument):
    def __init__(self, name, **kwargs):
        super().__init__(name, **kwargs)

        self.add_parameter(
            "f_start",
            initial_value=0,
            unit="Hz",
            label="f start",
            vals=Numbers(0, 1e3),
            get_cmd=None,
            set_cmd=None,
        )

        self.add_parameter(
            "f_stop",
            unit="Hz",
            label="f stop",
            vals=Numbers(1, 1e3),
            get_cmd=None,
            set_cmd=None,
        )

        self.add_parameter(
            "n_points",
            unit="",
            initial_value=10,
            vals=Numbers(1, 1e3),
            get_cmd=None,
            set_cmd=None,
        )

        self.add_parameter(
            "freq_axis",
            unit="Hz",
            label="Freq Axis",
            parameter_class=GeneratedSetPoints,
            startparam=self.f_start,
            stopparam=self.f_stop,
            numpointsparam=self.n_points,
            vals=Arrays(shape=(self.n_points.get_latest,)),
        )

        self.add_parameter(
            "spectrum",
            unit="dBm",
            setpoints=(self.freq_axis,),
            label="Spectrum",
            parameter_class=DummyArray,
            vals=Arrays(shape=(self.n_points.get_latest,)),
        )
In the above example, the shape is defined by the parameter n_points that defines how many samples our DummySpectrumAnalyzer returns.
This means that the validation will call the function to get n_points twice for each get of the parameter. This may be too slow, however, if you (as the driver-writer) can guarantee that the cached value for n_points will never be out of sync with the value stored in the instrument, n_points may be replaced by it’s latest known value such that the validator reads:
vals=Arrays(shape=(self.n_points.get_latest))
This avoids any additional call to the instrument. In the same way, the arguments to the freq_axis parameter that defines the start, stop and number of points can be replaced by their latest value if the instrument allows it.
[6]:
tutorial_db_path = (
    Path.cwd().parent / "example_output" / "tutorial_paramter_with_setpoints.db"
)
initialise_or_create_database_at(tutorial_db_path)
load_or_create_experiment(
    experiment_name="tutorial_ParameterWithSetpoints", sample_name="no sample"
)
[6]:
tutorial_ParameterWithSetpoints#no sample#1@/home/runner/work/Qcodes/Qcodes/docs/examples/example_output/tutorial_paramter_with_setpoints.db
--------------------------------------------------------------------------------------------------------------------------------------------
1-results-1-dmm_setpoints,dmm_current-1
2-results-2-dmm_setpoints,dmm_current-1
3-results-3-dmm_setpoints,dmm_current-1
[7]:
a = DummySpectrumAnalyzer("foobar")
First we setup the limits of the spectrum
[8]:
a.f_start(0)
a.f_stop(500)
a.n_points(501)
And we can grab the frequency axis
[9]:
a.n_points()
[9]:
501
[10]:
freq_axis = a.freq_axis()
len(freq_axis)
[10]:
501
[11]:
freq_axis[:10]
[11]:
array([0., 1., 2., 3., 4., 5., 6., 7., 8., 9.])
As expected we get a result wit 501 points as we asked for an axis with 501 points.
Above we have added a validator to the freq_axis parameter encoding the fact that this is an Array with n_points. Note that we do not have to supply the number of points as an integer but can supply a function that returns the valid number of points. This would normally be a QCoDeS parameter.
This will be checked if we validate the output.
[12]:
a.freq_axis.validate(a.freq_axis.get())
Naturally, we can also get the spectrum. Getting the spectrum will automatically perform validation both for the shape of the parameter itself and the relation to the setpoint parameter(s)
[13]:
spectrum = a.spectrum.get()
len(spectrum)
[13]:
501
When we validate a ParameterWithSetpoints, we automatically validate that the shape is consistent between the parameters and its setpoints. As well as validating the shape as above.
[14]:
a.spectrum.validate(a.spectrum.get())
The consistent shapes can be validated explicitly.
[15]:
a.spectrum.validate_consistent_shape()
We can inspect the setpoints of the spectrum.
[16]:
a.spectrum.setpoints
[16]:
(<__main__.GeneratedSetPoints: freq_axis at 140094856298672>,)
Or even change them.
[17]:
a.spectrum.setpoints = (a.freq_axis,)
Measurement
We can also directly consume the parameter in a measurement without defining the setpoints of the parameter again. The setpoints are automatically obtained from the definition of the ParameterWithSetpoint instance.
[18]:
meas = Measurement()
meas.register_parameter(a.spectrum)

with meas.run() as datasaver:
    datasaver.add_result((a.freq_axis, a.freq_axis()), (a.spectrum, a.spectrum()))
    dataset = datasaver.dataset
Starting experimental run with id: 4.
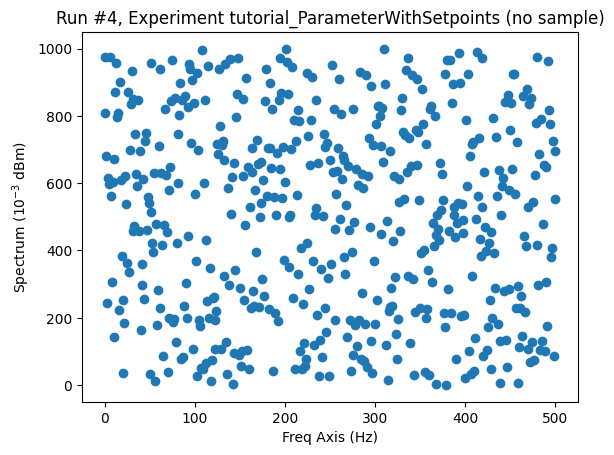
And plot it
[19]:
plot_dataset(dataset)
[19]:
([<Axes: title={'center': 'Run #4, Experiment tutorial_ParameterWithSetpoints (no sample)'}, xlabel='Freq Axis (Hz)', ylabel='Spectrum ($10^{-3}$ dBm)'>],
 [None])
To reduce the amount of typing, if a ParameterWithSetpoints is given without its setpoints, the setpoints will be fetched automatically, get will be called on them, and the obtained data will be added to the results.
Note that it is an error to supply values for some but not all of the setpoints.
Measure a ParameterWithSetpoints while sweeping another parameter
First we add another parameter. This parameter will just serve the example of having something to sweep that is not directly connected to the spectrum.
[20]:
a.add_parameter("external_param", set_cmd=None)
[20]:
<qcodes.parameters.parameter.Parameter: external_param at 140094066286928>
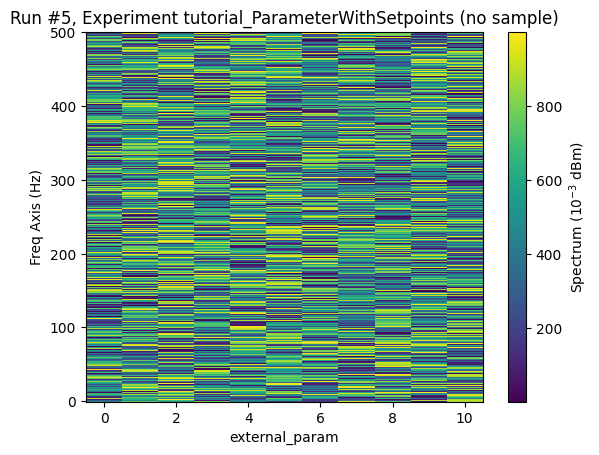
Now we can sweep the external parameter and measure the parameter with setpoints at each step.
[21]:
meas = Measurement()
meas.register_parameter(a.external_param)
meas.register_parameter(a.spectrum, setpoints=(a.external_param,))

with meas.run() as datasaver:
    for b in np.linspace(0, 10, 11):
        a.external_param(b)
        datasaver.add_result((a.external_param, b), (a.spectrum, a.spectrum.get()))
    dataid = datasaver.run_id

plot_dataset(datasaver.dataset)
Starting experimental run with id: 5.
[21]:
([<Axes: title={'center': 'Run #5, Experiment tutorial_ParameterWithSetpoints (no sample)'}, xlabel='external_param', ylabel='Freq Axis (Hz)'>],
 [<matplotlib.colorbar.Colorbar at 0x7f6a31051130>])