Task 3.1: Build ML models, experiments, and Log ML model in the built-in model registry using MLflow and batch scoring
Databricks
The architecture diagram shown here illustrates the end-to-end MLOps pipeline using the Azure Databricks managed MLflow.
After multiple iterations with various hyperparameters, the best performing model is registered in the Databricks MLflow model registry. Then it is set up as the model serving in the Azure Databricks Workspace for low latency requests.
-
Switch back to the Databricks workspace tab from the previous exercise.
-
In the left navigation, select Workspace.
-
In the Workspace pane, select Workspace and then select the 03_ML_Solutions_in_a_Box.ipynb notebook.
Now that we’ve processed our customer data, let us use Machine learning model to predict customer churn.
Ultimately, we would like to understand our customers’ sentiment so we can create targeted campaigns to improve our sales.
-
Go to cmd 10.
With the data prepared, we can begin exploring the patterns it contains.
As illustrated in this chart, we can see a high churn rate is seen if the customer tenure is low, and they have a lower spend amount.
-
Go to cmd 21.
By registering this model in Model Registry, we can easily reference the model from anywhere within Databricks.
-
Review the cmd 29 cell.
This comparison of multiple runs using a parallel coordinates plot, shows the impact of different parameter values on a metric.
The best ML model for Customer Churn is selected and registered with Databricks model registry.
-
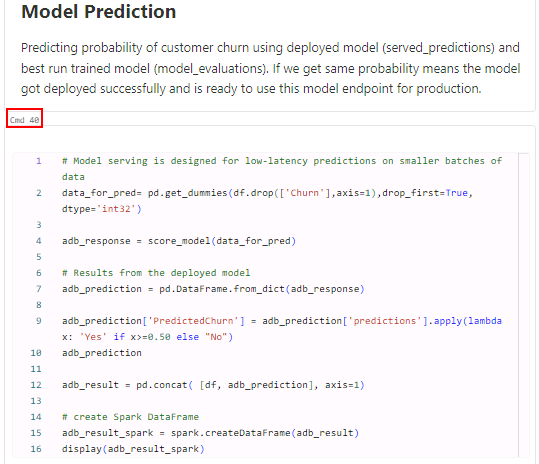
Go to cmd 40.
It is then used to predict the probability of Customer Churn using the deployed model and this model endpoint is ready for production.

-
Go to cmd 41.
Once we have the predicted data, it is stored back in delta tables in the gold layer back in OneLake.
Data ingestion: Notebook Code-first experience
As Data Engineer, you will explorer another option for ingesting the data. This time Eva prefers using the code-first experience.
-
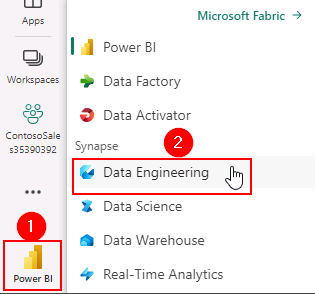
Switch to the Power BI workspace browser tab, in the lower left corner, select the icon and then select Data Engineering.

-
Select Import notebook.

-
In the Import Status pane, select Upload.
-
Browse to C:\Ignite Assets\IgniteDreamLab2023\artifacts\fabricnotebooks, select all of the notebooks and then select Open.
-
Select the notification icon to check the upload status.
-
Once the upload is complete, the notification will display Imported successfully. Select Go to Workspace.
-
In the ContosoSales@lab.LabInstance.Id workspace, select the 01 Marketing Data to Lakehouse (Bronze) - Code-First Experience notebook.
-
In the left pane, select Lakehouses, select Missing Lakehouse and select Remove all Lakehouses.
If you do not see Missing lakehouse, you may see lakehouse{Name}, select it to get the Remove all Lakehouses option.
-
Select Continue.
-
In the left navigation pane, select Add.
-
In the Add Lakehouse window, select Existing Lakehouse and then select Add.
-
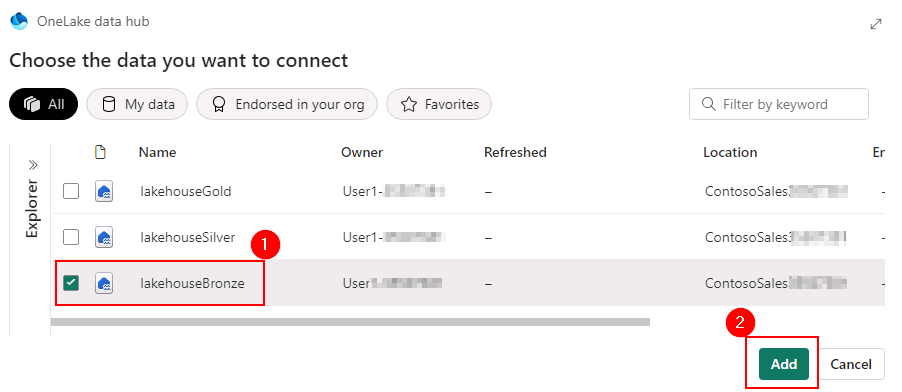
Select the lakehouseBronze checkbox and then select Add.

-
Close the Information box for a better view of the notebook content.
-
Scroll down to the cell named Shortcut Folder Path, replace #WORKSPACE_NAME# , select ContosoSales@lab.LabInstance.Id.
Make sure you delete the ”#” too in above step

-
On the menu, select Run all.

-
Wait for the cells to complete. This may take 3-5 minutes.
SQL Query
-
In Power BI, select Workspaces and select the ContosoSales@lab.LabInstance.Id workspace.
-
In the ContosoSales@lab.LabInstance.Id workspace, select the lakehouseSilver Lakehouse.
-
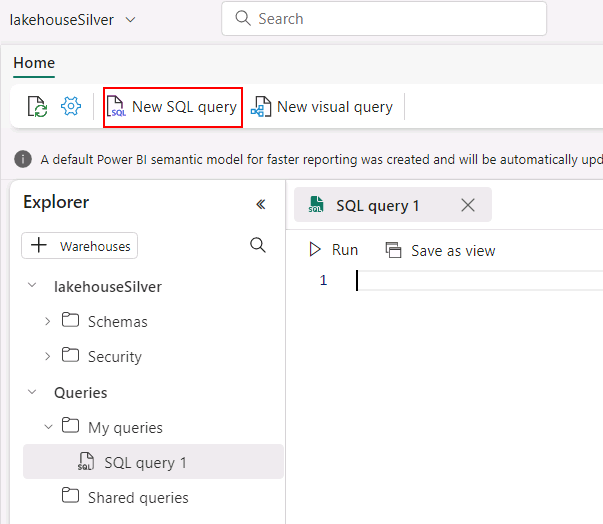
Select New SQL Query.

- Enter the following SQL query:
Select fc.ProductCategory,Sum(fc.Revenue) Revenue from [lakehouseSilver].[dbo].[dimension_product] dp JOIN [lakehouseSilver].[dbo].[fact_campaigndata] fc on dp.Category=fc.[ProductCategory] Group by fc.ProductCategory having sum(fc.[Revenue])< (Select Top 1 Sum(fc.Revenue) Revenue from [lakehouseSilver].[dbo].[dimension_product] dp JOIN [lakehouseSilver].[dbo].[fact_campaigndata] fc on dp.Category=fc.[ProductCategory] Group by fc.ProductCategory ORDER by Revenue DESC) ORDER by Revenue DESC -
Select Run.

-
Review the results of the query.
