Task 6.4: Create a Real-time Power BI report using KQL DB/KQL Query
-
Select Build Power BI report.

-
Hover over the Power BI Report layout and navigation panel.
-
Review the table on the right side.
-
Close the Power BI report page.
-
In the Power BI service, select Workspaces and select ContosoSales@lab.LabInstance.Id.
-
Select Upload and select Browse.
-
Go to C:\Ignite Assets\IgniteDreamLab2023\artifacts\reports, select the Real-Time and Historical in-store analytics with KQLDB.pbix report and the select the Open.
Wait for the report to upload.
-
In the left navigation, select the ContosoSales@lab.LabInstance.Id workspace.
-
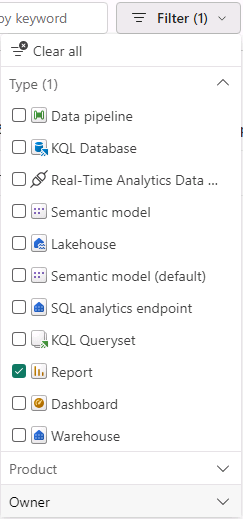
Set the Filter to Report and select the Real-Time and Historical in-store analytics with KQLDB report.

-
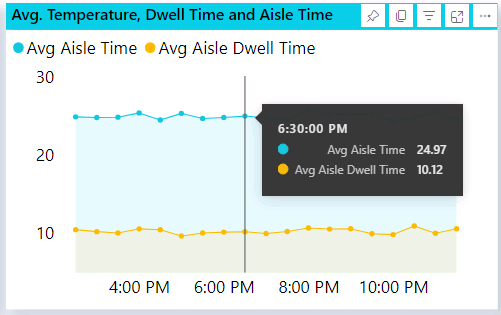
Hover over the Average Temperature to review the real-time data in Power BI.

Congratulations! You have completed the TechBoost: Fabric with Databricks for Data Analytics (lvl 200 / STU) lab.