Pairplot: Visualizing High Dimensional Data
This example provides how to visualize high dimensional data using the pairplot.
[1]:
import graspologic

import numpy as np
%matplotlib inline
Simulate a binary graph using stochastic block model
The 3-block model is defined as below:
\begin{align*} n &= [50, 50, 50]\\ P &= \begin{bmatrix}0.5 & 0.1 & 0.05 \\ 0.1 & 0.4 & 0.15 \\ 0.05 & 0.15 & 0.3 \end{bmatrix} \end{align*}
Thus, the first 50 vertices belong to block 1, the second 50 vertices belong to block 2, and the last 50 vertices belong to block 3.
[2]:
from graspologic.simulations import sbm

n_communities = [50, 50, 50]
p = [[0.5, 0.1, 0.05],
     [0.1, 0.4, 0.15],
     [0.05, 0.15, 0.3],]

np.random.seed(2)
A = sbm(n_communities, p)
Embed using adjacency spectral embedding to obtain lower dimensional representation of the graph
The embedding dimension is automatically chosen. It should embed to 3 dimensions.
[3]:
from graspologic.embed import AdjacencySpectralEmbed

ase = AdjacencySpectralEmbed()
X = ase.fit_transform(A)

print(X.shape)
(150, 3)
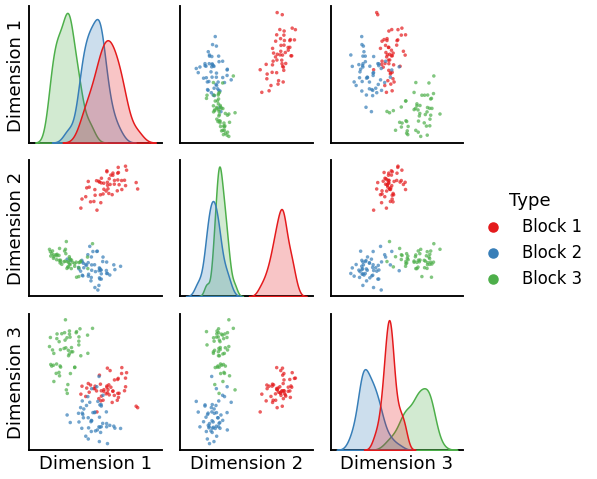
Use pairplot to plot the embedded data
First we generate labels that correspond to blocks. We pass the labels along with the data for pair plot.
[4]:
from graspologic.plot import pairplot

labels = ['Block 1'] * 50 + ['Block 2'] * 50 + ['Block 3'] * 50

plot = pairplot(X, labels)
[ ]: