Count top words in subject lines grouped by a custom attribute
Source:R/subject_scan.R
subject_scan.Rd![[Experimental]](figures/lifecycle-experimental.svg)
This function generates a matrix of the top occurring words in meetings, grouped by a specified attribute such as organisational attribute, day of the week, or hours of the day.
subject_scan(
  data,
  hrvar,
  mode = NULL,
  top_n = 10,
  token = "words",
  return = "plot",
  weight = NULL,
  stopwords = NULL,
  ...
)

tm_scan(
  data,
  hrvar,
  mode = NULL,
  top_n = 10,
  token = "words",
  return = "plot",
  weight = NULL,
  stopwords = NULL,
  ...
)
Arguments
- data
A Meeting Query dataset in the form of a data frame.
- hrvar
String containing the name of the HR Variable by which to split metrics. Note that the prefix
'Organizer_'or equivalent will be required.- mode
String specifying what variable to use for grouping subject words. Valid values include:
"hours""days"NULL(defaults tohrvar) When the value passed tomodeis notNULL, the value passed tohrvarwill be discarded and instead be over-written by setting specified inmode.
- top_n
Numeric value specifying the top number of words to show.
- token
A character vector accepting either
"words"or"ngrams", determining type of tokenisation to return.- return
String specifying what to return. This must be one of the following strings:
"plot""table""data"
See
Valuefor more information.- weight
String specifying the column name of a numeric variable for weighting data, such as
"Invitees". The column must contain positive integers. Defaults toNULL, where no weighting is applied.- stopwords
A character vector OR a single-column data frame labelled
'word'containing custom stopwords to remove.- ...
Additional parameters to pass to
tm_clean().
Value
A different output is returned depending on the value passed to the return
argument:
"plot": 'ggplot' object. A heatmapped grid."table": data frame. A summary table for the metric."data": data frame.
Examples
# \donttest{
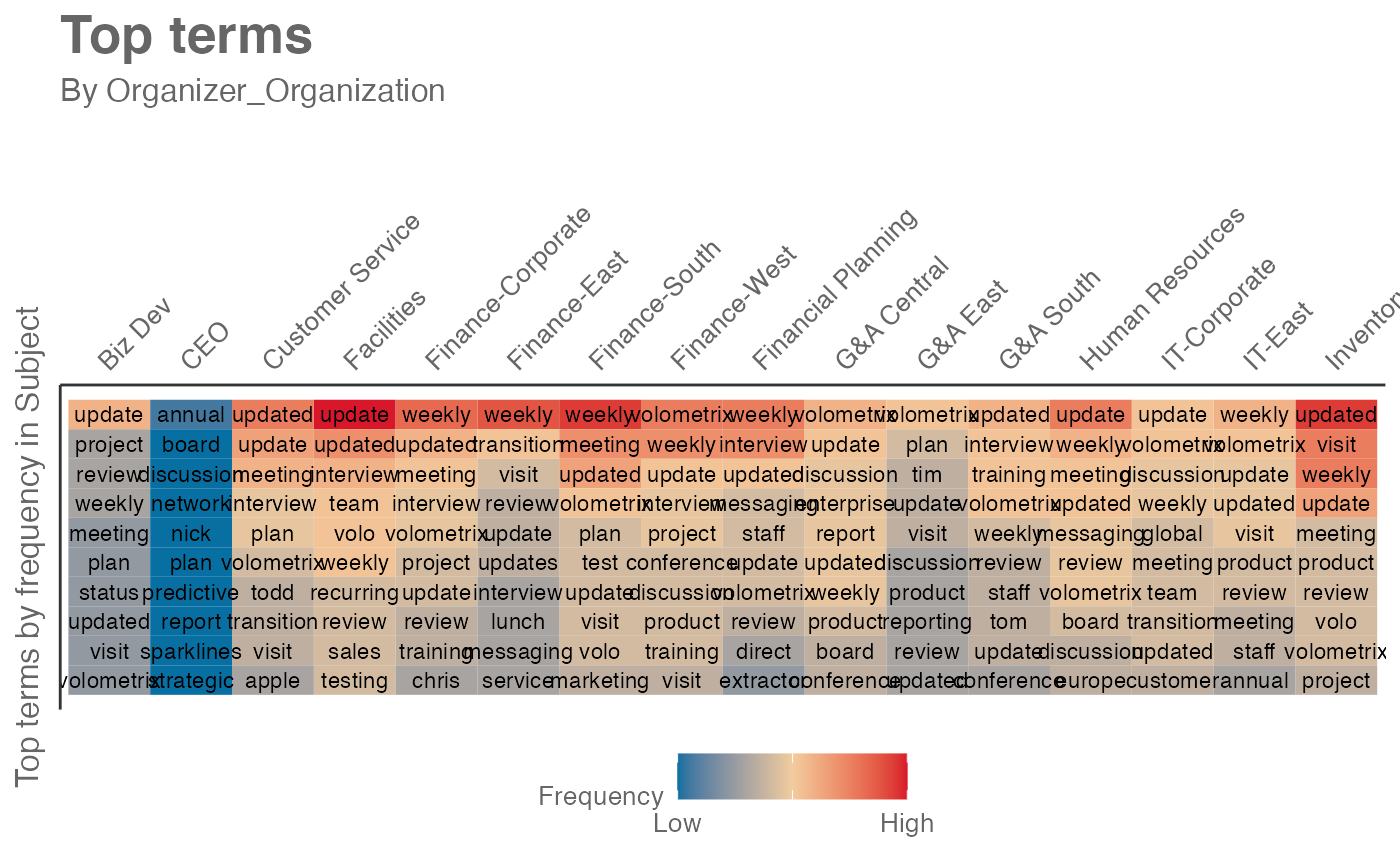
# return a heatmap table for words
mt_data %>% subject_scan(hrvar = "Organizer_Organization")
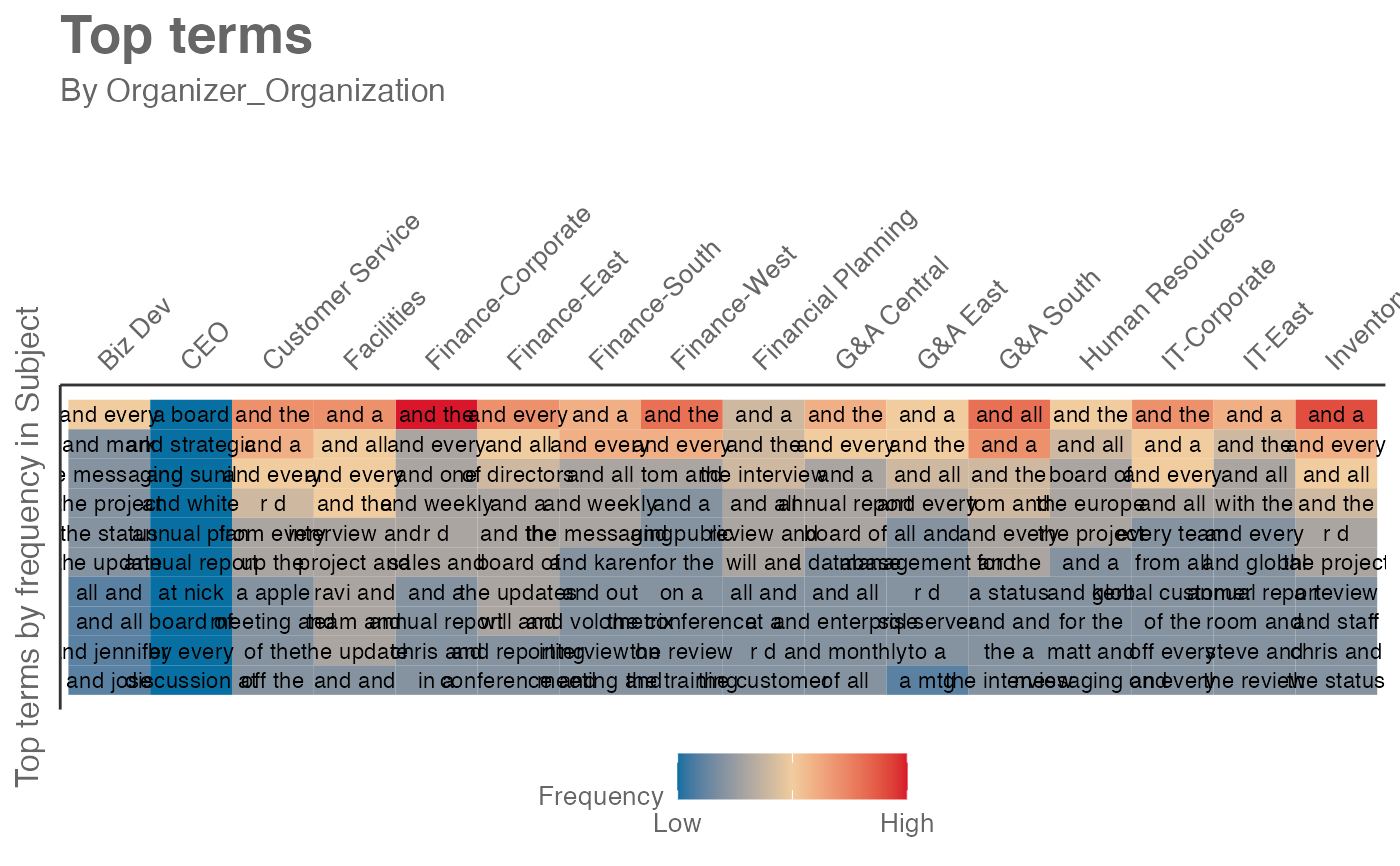
 # return a heatmap table for ngrams
mt_data %>%
subject_scan(
hrvar = "Organizer_Organization",
token = "ngrams",
n = 2)
# return a heatmap table for ngrams
mt_data %>%
subject_scan(
hrvar = "Organizer_Organization",
token = "ngrams",
n = 2)
 # return raw table format
mt_data %>% subject_scan(hrvar = "Organizer_Organization", return = "table")
#> # A tibble: 10 × 16
#> `Biz Dev` CEO `Customer Service` Facilities `Finance-Corporate`
#> <chr> <chr> <chr> <chr> <chr>
#> 1 update annual updated update weekly
#> 2 project board update updated updated
#> 3 review discussion meeting interview meeting
#> 4 weekly network interview team interview
#> 5 meeting nick plan volo volometrix
#> 6 plan plan volometrix weekly project
#> 7 status predictive todd recurring update
#> 8 updated report transition review review
#> 9 visit sparklines visit sales training
#> 10 volometrix strategic apple testing chris
#> # ℹ 11 more variables: `Finance-East` <chr>, `Finance-South` <chr>,
#> # `Finance-West` <chr>, `Financial Planning` <chr>, `G&A Central` <chr>,
#> # `G&A East` <chr>, `G&A South` <chr>, `Human Resources` <chr>,
#> # `IT-Corporate` <chr>, `IT-East` <chr>, `Inventory Management` <chr>
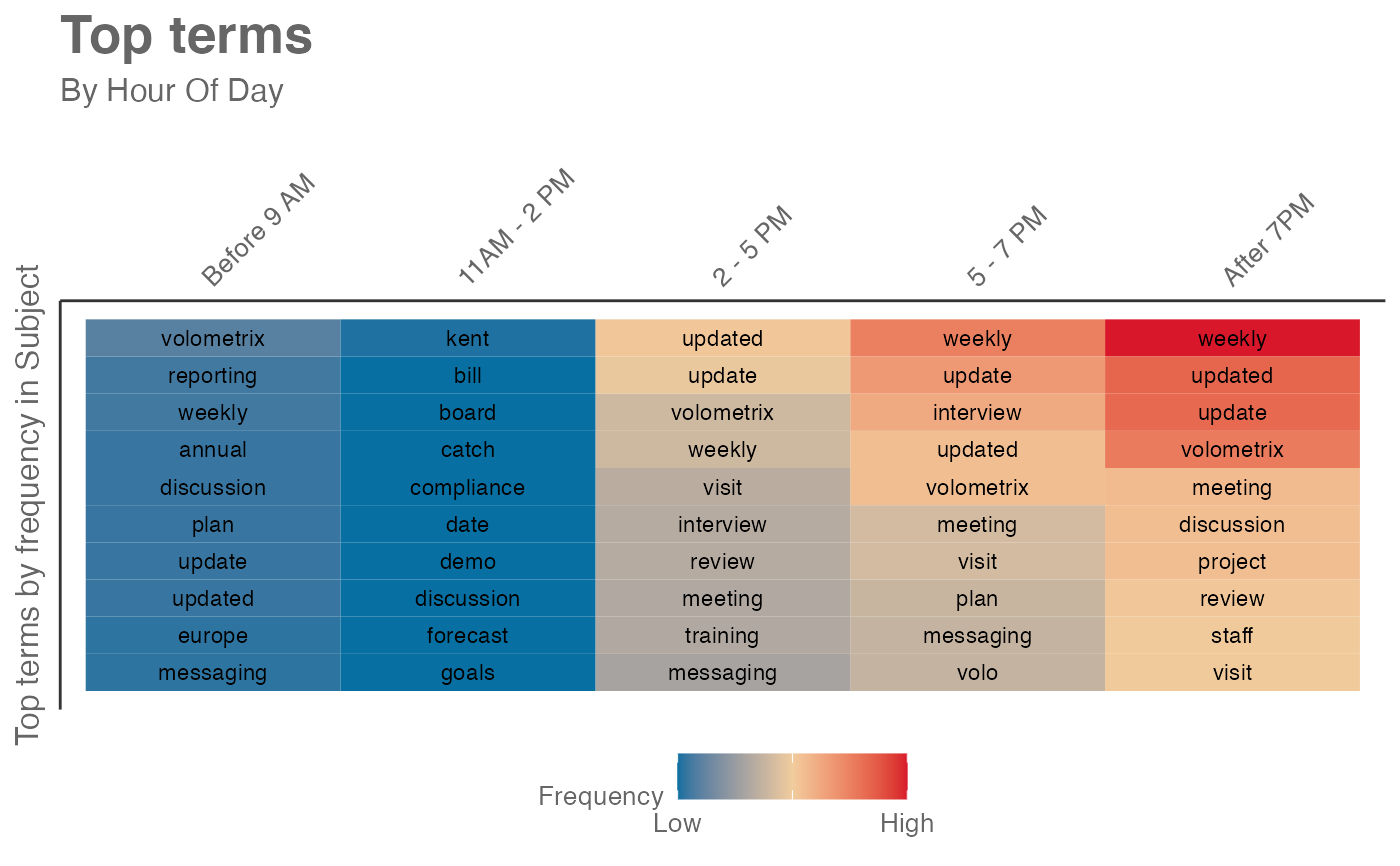
# grouped by hours
mt_data %>% subject_scan(mode = "hours")
# return raw table format
mt_data %>% subject_scan(hrvar = "Organizer_Organization", return = "table")
#> # A tibble: 10 × 16
#> `Biz Dev` CEO `Customer Service` Facilities `Finance-Corporate`
#> <chr> <chr> <chr> <chr> <chr>
#> 1 update annual updated update weekly
#> 2 project board update updated updated
#> 3 review discussion meeting interview meeting
#> 4 weekly network interview team interview
#> 5 meeting nick plan volo volometrix
#> 6 plan plan volometrix weekly project
#> 7 status predictive todd recurring update
#> 8 updated report transition review review
#> 9 visit sparklines visit sales training
#> 10 volometrix strategic apple testing chris
#> # ℹ 11 more variables: `Finance-East` <chr>, `Finance-South` <chr>,
#> # `Finance-West` <chr>, `Financial Planning` <chr>, `G&A Central` <chr>,
#> # `G&A East` <chr>, `G&A South` <chr>, `Human Resources` <chr>,
#> # `IT-Corporate` <chr>, `IT-East` <chr>, `Inventory Management` <chr>
# grouped by hours
mt_data %>% subject_scan(mode = "hours")
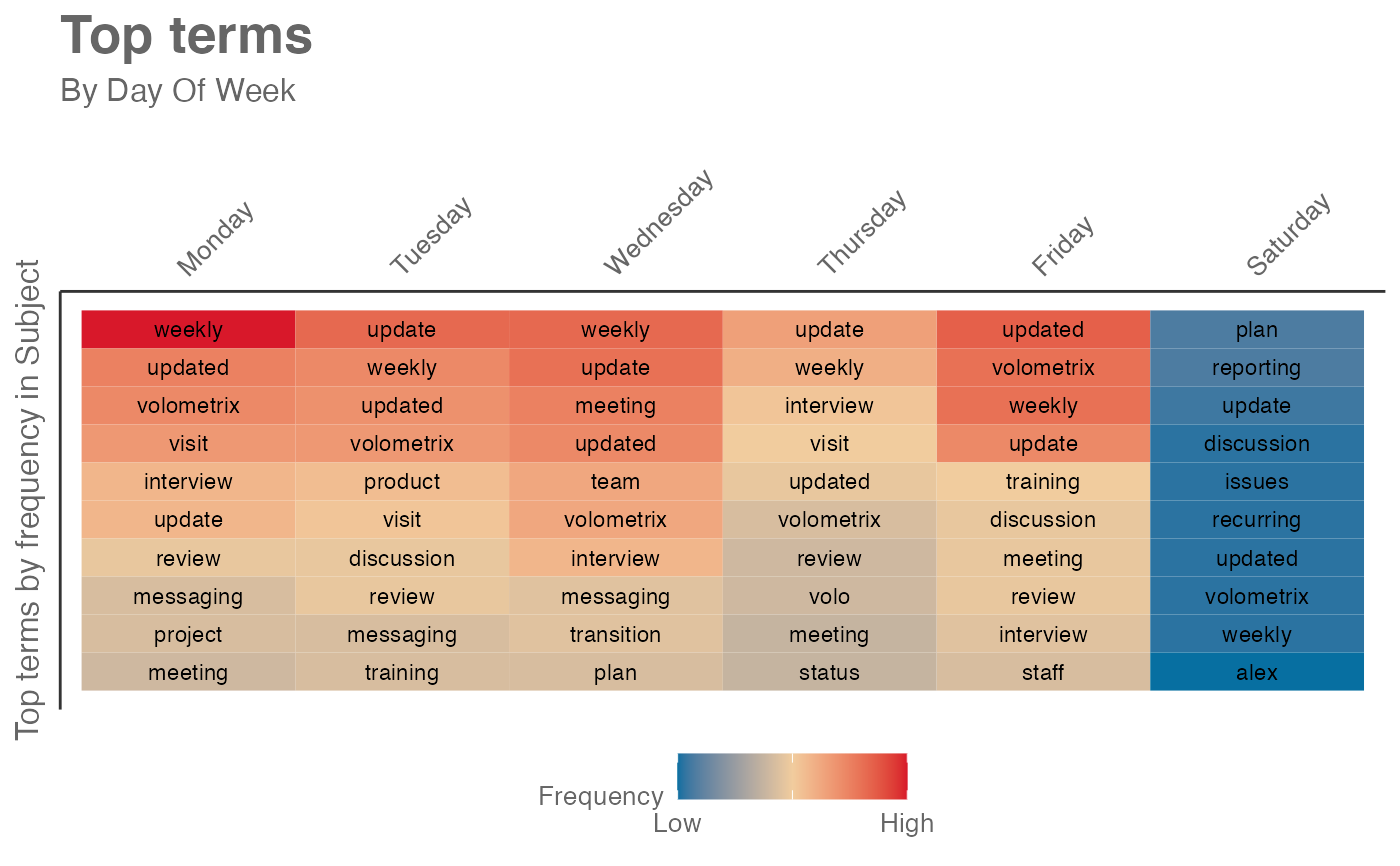
 # grouped by days
mt_data %>% subject_scan(mode = "days")
# grouped by days
mt_data %>% subject_scan(mode = "days")
 # }
# }