Distribution Functions
Distribution functions allow you to drill deeper into groups, to diagnose if the averages are truly representative of that group, or if they are hiding pockets of individuals with divergent behaviour (outliers).
Grouping individuals
The collaboration_dist() function produces a 100% stacked bar chart, with all individuals classified in pre-defined groups according to defined ranges of collaboration hours. This function uses a Standard Person Query as input:
sq_data %>% collaboration_dist() You can specify which HR attribute/variable to use as a grouping variable with the hrvar argument, and what output to obtain (either “plot” or “table”) with the return argument.
sq_data %>% collaboration_dist(hrvar = "LevelDesignation", return="table") wpa includes a wide range of equivalent functions, that create 100% stacked bar plots for specific metrics. These include:
Fizzy Drink Plots
You can also explore distributions by using jittered (‘fizzy drink’) scatter plots. The collaboration_fizz() function illustrates how different individuals fall in a common scale:
sq_data %>% email_fizz() # Fizzy drink plotAs usual, you to specify an HR attribute grouping variable and create a table with the return argument.
sq_data %>% collaboration_fizz(hrvar = "LevelDesignation", return = "table")Other examples of distribution fizzy drink plots include:
Custom bar charts and tables
Not all metrics include their own dist and fizz functions. However, you can obtain the equivalent graphs using the create_dist() and create_fizz(). These functions requires you to include a character string containing the name of the metric you want to analyze. Additionall, the create_boxplot() function allows you to create a box plot.
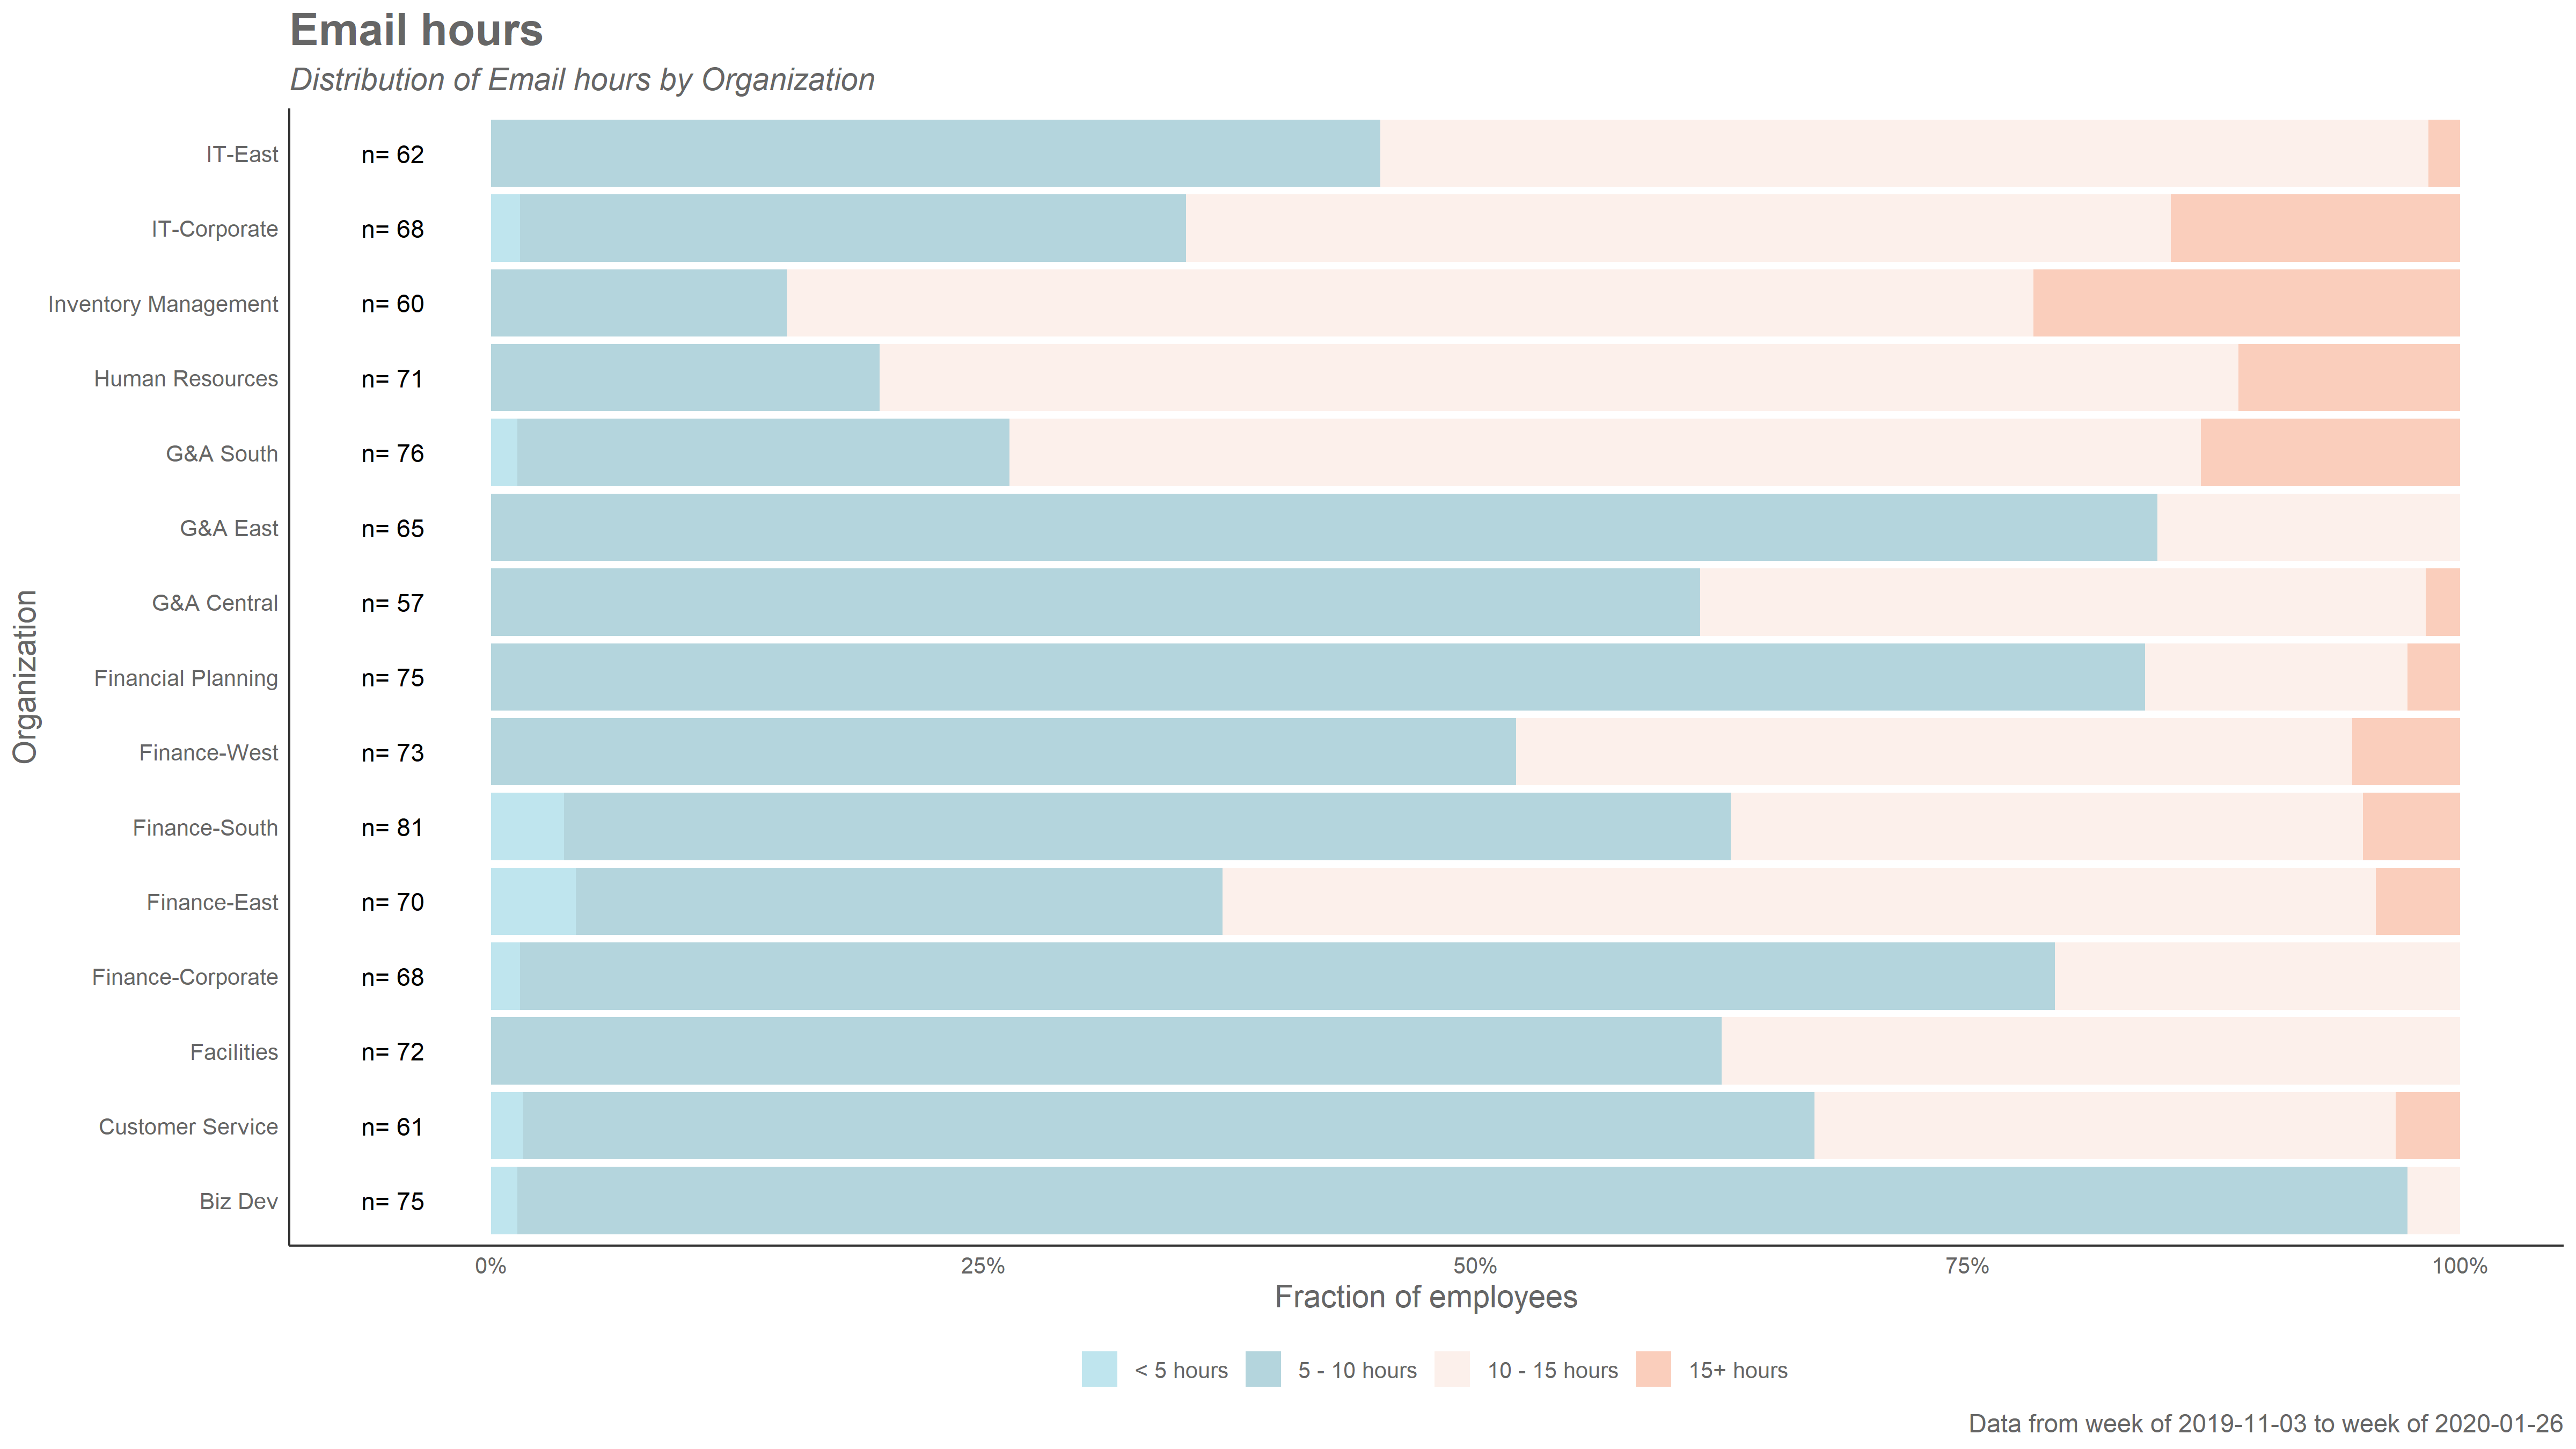
For example, using “Generated_workload_email_hours”:
sq_data %>% create_dist(metric = "Generated_workload_email_hours")

sq_data %>% create_fizz(metric = "Generated_workload_email_hours")

sq_data %>% create_boxplot(metric = "Generated_workload_email_hours")
Exploring changes over time
In our next section, we will cover Trend Functions that are useful to explore time dyanmics across a wide range of metrics.