Perform a Word or Ngram Frequency Analysis and return a Circular Bar Plot
Source:R/tm_freq.R
tm_freq.RdGenerate a circular bar plot with frequency of words / ngrams.
This function is used within meeting_tm_report().
tm_freq(data, token = "words", stopwords = NULL, keep = 100, return = "plot")Arguments
- data
A Meeting Query dataset in the form of a data frame.
- token
A character vector accepting either
"words"or"ngram", determining type of tokenisation to return.- stopwords
A character vector OR a single-column data frame labelled
'word'containing custom stopwords to remove.- keep
A numeric vector specifying maximum number of words to keep.
- return
String specifying what to return. This must be one of the following strings:
"plot""table"
See
Valuefor more information.
Value
A different output is returned depending on the value passed to the return
argument:
"plot": 'ggplot' object. A circular bar plot."table": data frame. A summary table.
Details
This function uses tm_clean() as the underlying data wrangling function.
There is an option to remove stopwords by passing a data frame into the
stopwords argument.
See also
Other Text-mining:
meeting_tm_report(),
pairwise_count(),
subject_validate(),
subject_validate_report(),
tm_clean(),
tm_cooc(),
tm_wordcloud()
Examples
# \donttest{
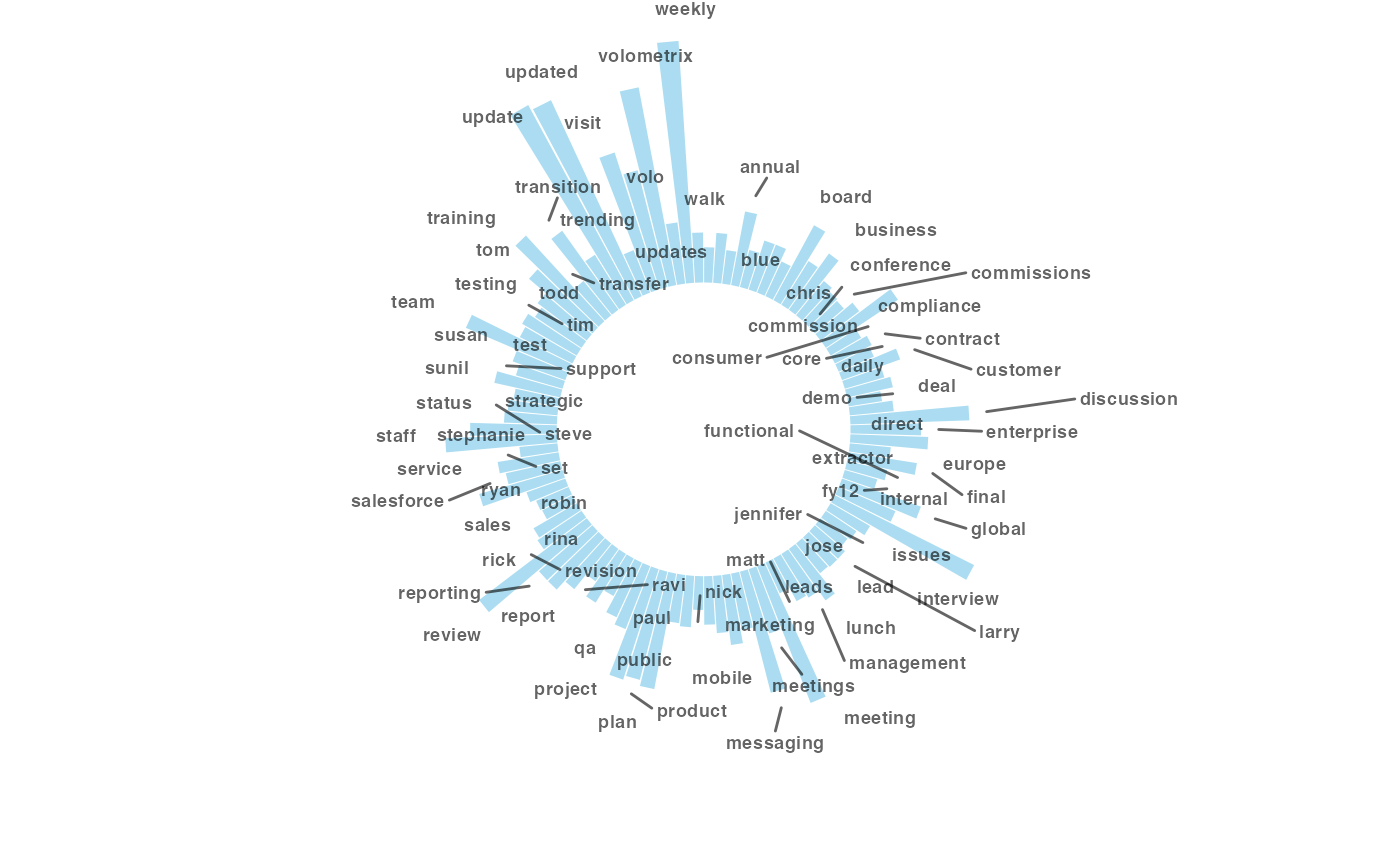
tm_freq(mt_data, token = "words")
#> Selecting by n
#> Warning: ggrepel: 3 unlabeled data points (too many overlaps). Consider increasing max.overlaps
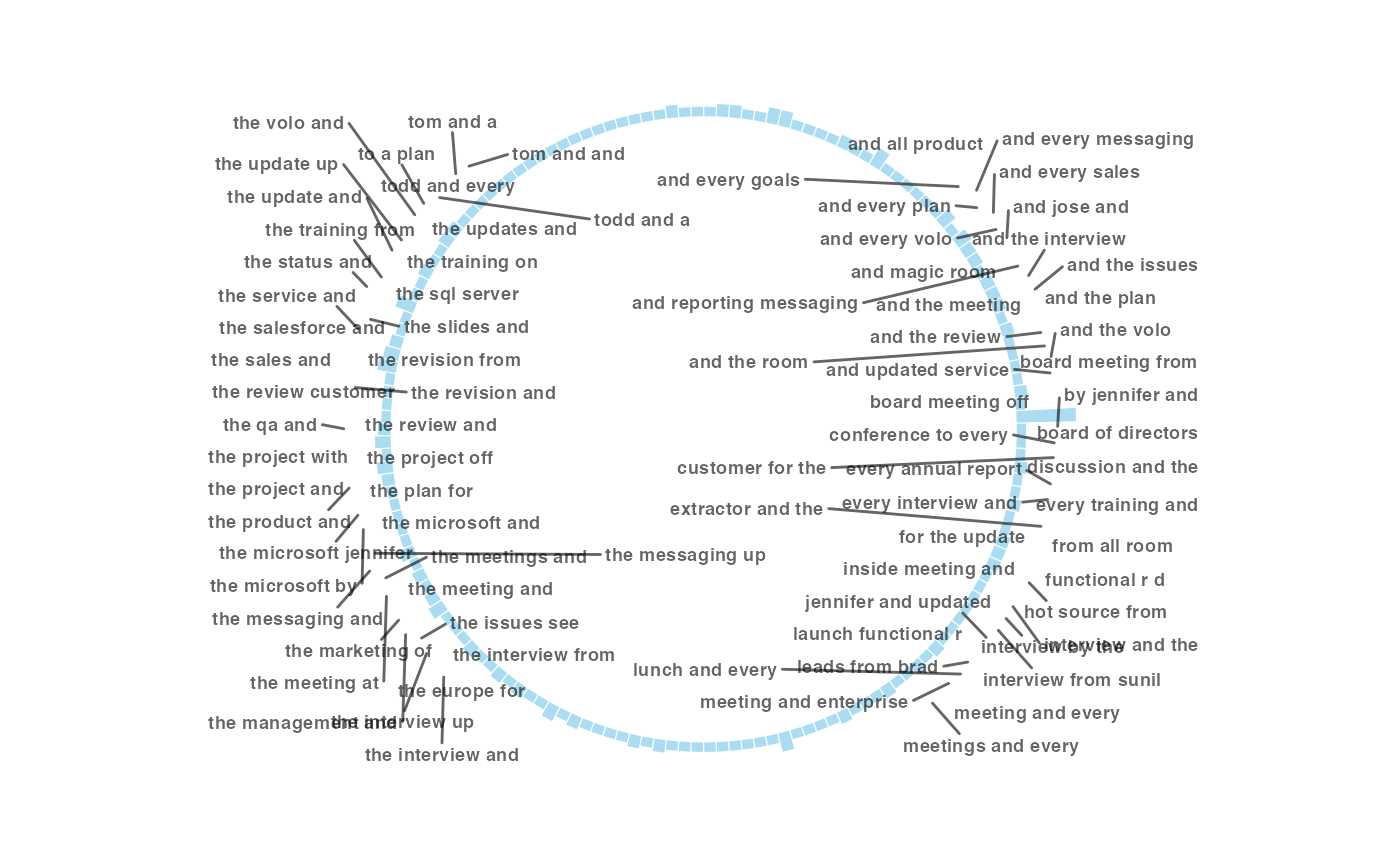
 tm_freq(mt_data, token = "ngrams")
#> Selecting by n
#> Warning: ggrepel: 52 unlabeled data points (too many overlaps). Consider increasing max.overlaps
tm_freq(mt_data, token = "ngrams")
#> Selecting by n
#> Warning: ggrepel: 52 unlabeled data points (too many overlaps). Consider increasing max.overlaps
 # }
# }