Challenge 2: Monitor with Application Insights
Time: ~20 minutes
Objectives
By the end of this challenge, you will have:
- ✅ GenAI tracing enabled for your Foundry agents
- ✅ Agent interactions visible as traces in Application Insights
- ✅ Understanding of how to debug agent behaviour in production
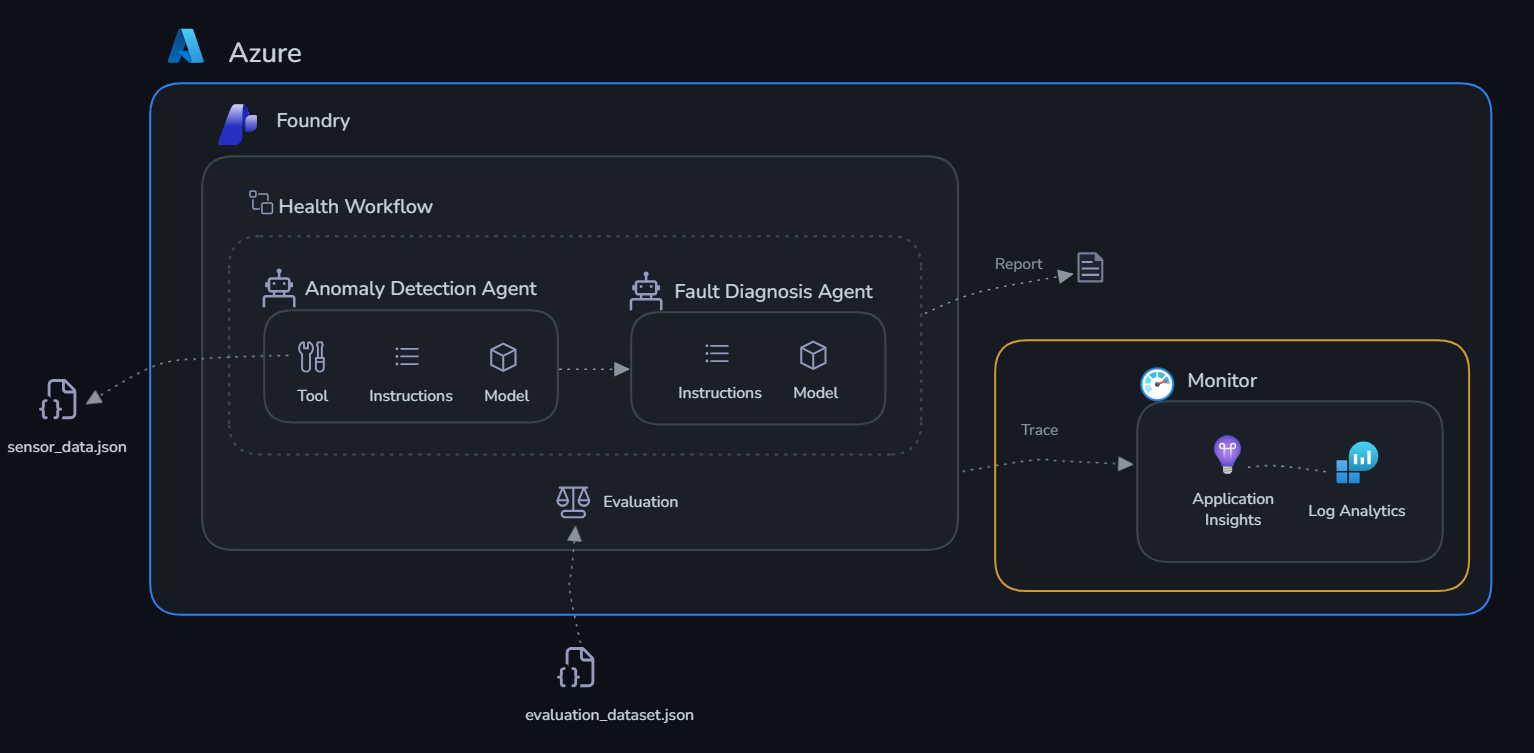
Context
Your agents work — but how do you know they're working well? What if an agent gives a bad answer? What if latency spikes? What if a tool call fails silently?
Application Insights with GenAI tracing gives you:
- Full trace of every agent interaction (user message → model call → tool calls → response)
- Token usage per request
- Latency breakdown (network, model inference, tool execution)
- Error tracking and alerting
Why Monitor?
AI agents behave differently from traditional software. A conventional API either returns the right data or throws an error — you can test it deterministically. An agent's output is probabilistic: the same input can produce subtly different responses on each run, tool calls can succeed but return unexpected data, and failures can be silent (the agent responds confidently but incorrectly). Without observability, these issues are invisible until a user reports them.
Monitoring serves three critical functions for AI agents:
- Reliability — Detect when agents stop working (tool call failures, timeouts, empty responses) before users do
- Performance — Track latency and token usage over time, catch regressions when you update a system prompt, and right-size your deployments for cost efficiency
- Debugging — When something goes wrong, distributed traces give you a complete record of what the model reasoned, what tools were called, what they returned, and exactly where the chain broke
For production AI systems, monitoring is the foundation that makes improvement possible. You can't fix what you can't see.
For TireForge specifically: a false negative from the Anomaly Detection Agent — reporting CP-003 as healthy when pressure is drifting toward failure — could mean a curing press breakdown mid-production run, scrapping an entire batch of tires. Traces show you exactly which sensor values the agent saw, what check_thresholds returned, and why the agent concluded "normal" — so you can fix the prompt or thresholds before it happens again.
Portal or SDK?
Microsoft Foundry gives you two ways to monitor agents. The Foundry portal (ai.azure.com/nextgen) has a built-in Tracing view where you can browse agent interactions, inspect individual spans, and see token usage and latency — no code required. Application Insights (via the Azure portal) gives you deeper analytics: Kusto queries, custom dashboards, and alerting rules.
In this challenge we use the SDK — monitor.py instruments your agents so every interaction is automatically captured as a distributed trace. Once the script runs, you'll explore those traces using both portal options, seeing how each one presents the same data differently.
Prerequisites
Make sure your .env has:
AZURE_EXPERIMENTAL_ENABLE_GENAI_TRACING=true
OTEL_INSTRUMENTATION_GENAI_CAPTURE_MESSAGE_CONTENT=true
APPLICATIONINSIGHTS_CONNECTION_STRING=InstrumentationKey=xxx;...
Connect Application Insights to the Portal
The deploy script automatically links Application Insights to your Foundry project. To confirm it worked, open the Microsoft Foundry portal, navigate to your project, and click Tracing in the left sidebar — you should see the Application Insights resource already connected.
If you see a "Create or connect an App Insights resource to get started" banner, the automatic connection was blocked by a tenant policy. Fix it in one click: click Connect, select the foundry-hack-insights-<suffix> resource from the dropdown, and confirm. You only need to do this once.
Get Started
Open monitor.py and review the tracing setup.
Once the script finishes, your traces are live. Explore them in the Azure Portal.
Step 1: Microsoft Foundry Portal
- Go to Microsoft Foundry Portal → open your project
-
Click on the
anomaly-detection-agent-> Traces -
Traces panel — The Conversations tab lists every agent run as a row, showing the conversation ID, trace ID, response ID, status, creation time, duration, tokens in/out, estimated cost, evaluation results, and agent version. Use the search box and the Status, Duration, Tokens, and Estimated Cost filters (plus the date-range selector) to narrow results, switch to the Responses tab for individual model responses, or click Create dataset to turn these traces into an evaluation dataset.

- You’ll see a list of recent traces — click any row to open it
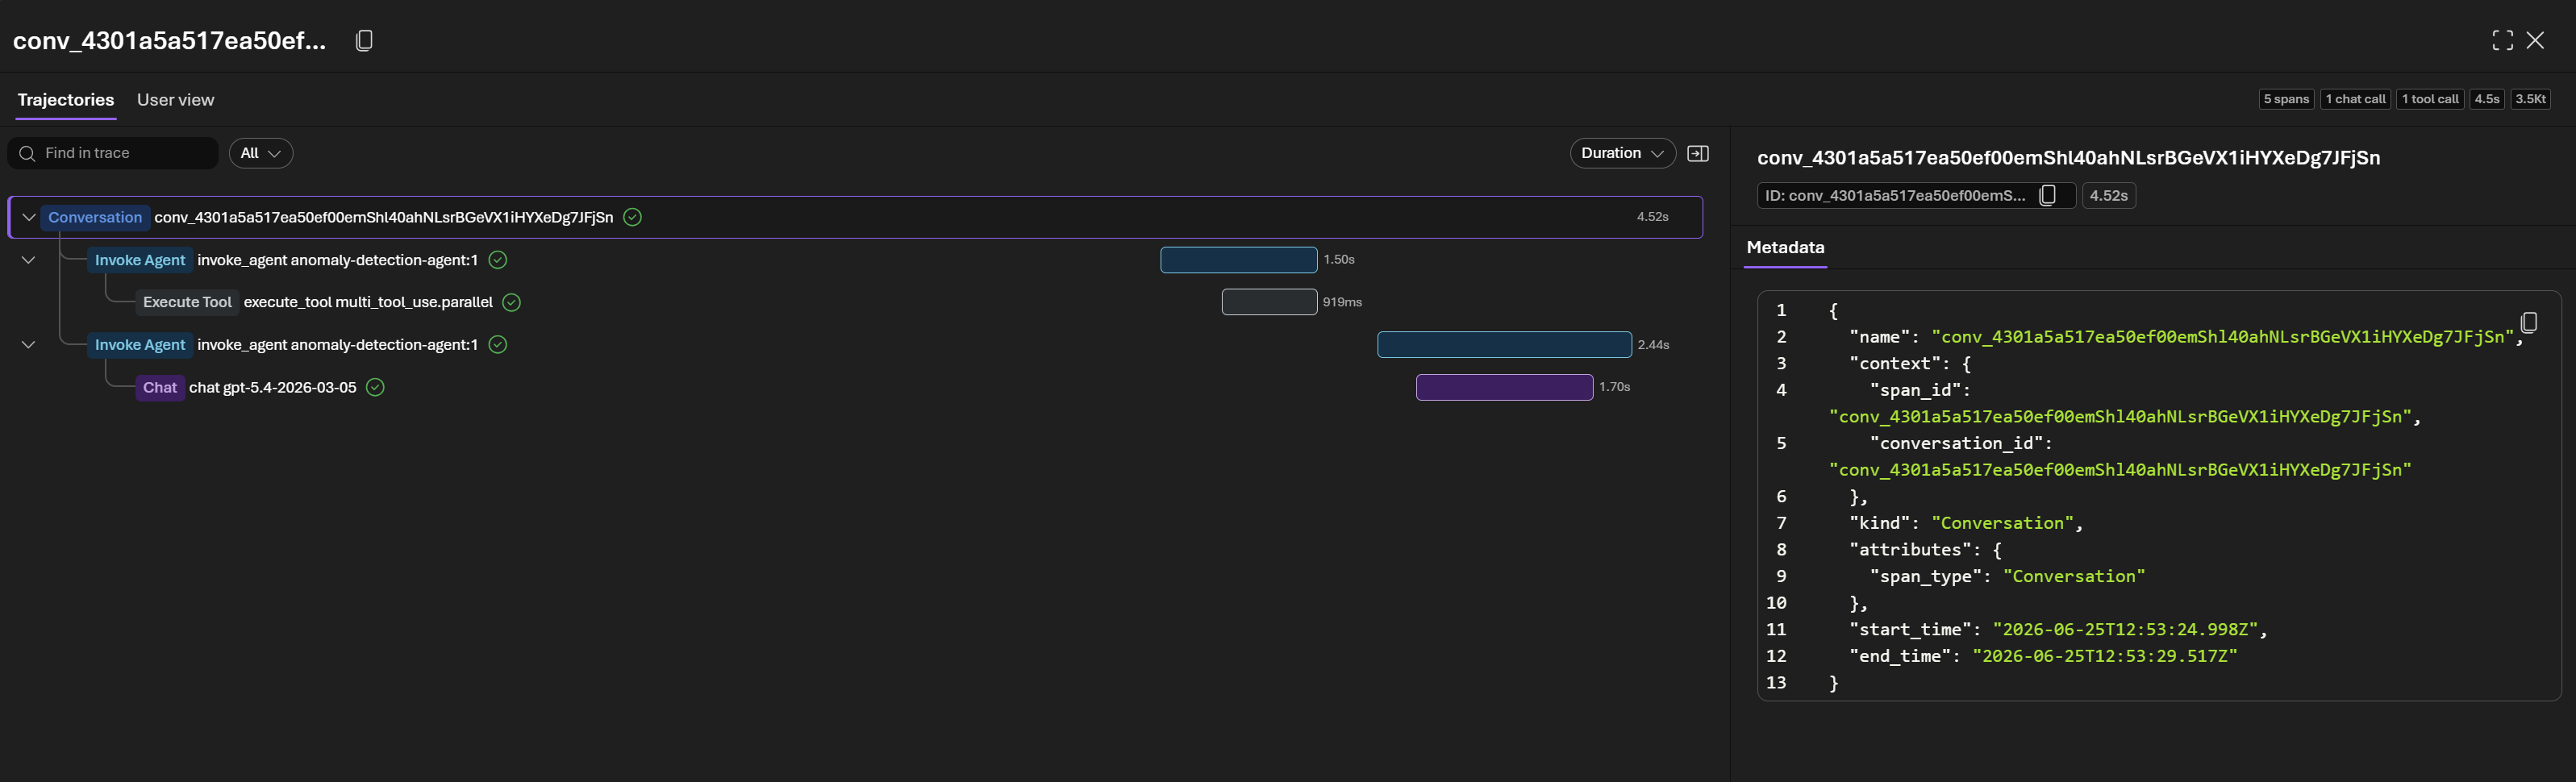
- Inside a trace you can see:
- Each agent turn as a span (input → output)
- Tool calls (
check_thresholds, etc.) as child spans with inputs/outputs - Token usage and latency per span
- The full model prompt and completion if
OTEL_INSTRUMENTATION_GENAI_CAPTURE_MESSAGE_CONTENT=true - Use the timeline view to spot slow spans, and the details panel to inspect individual messages
-
Click on the
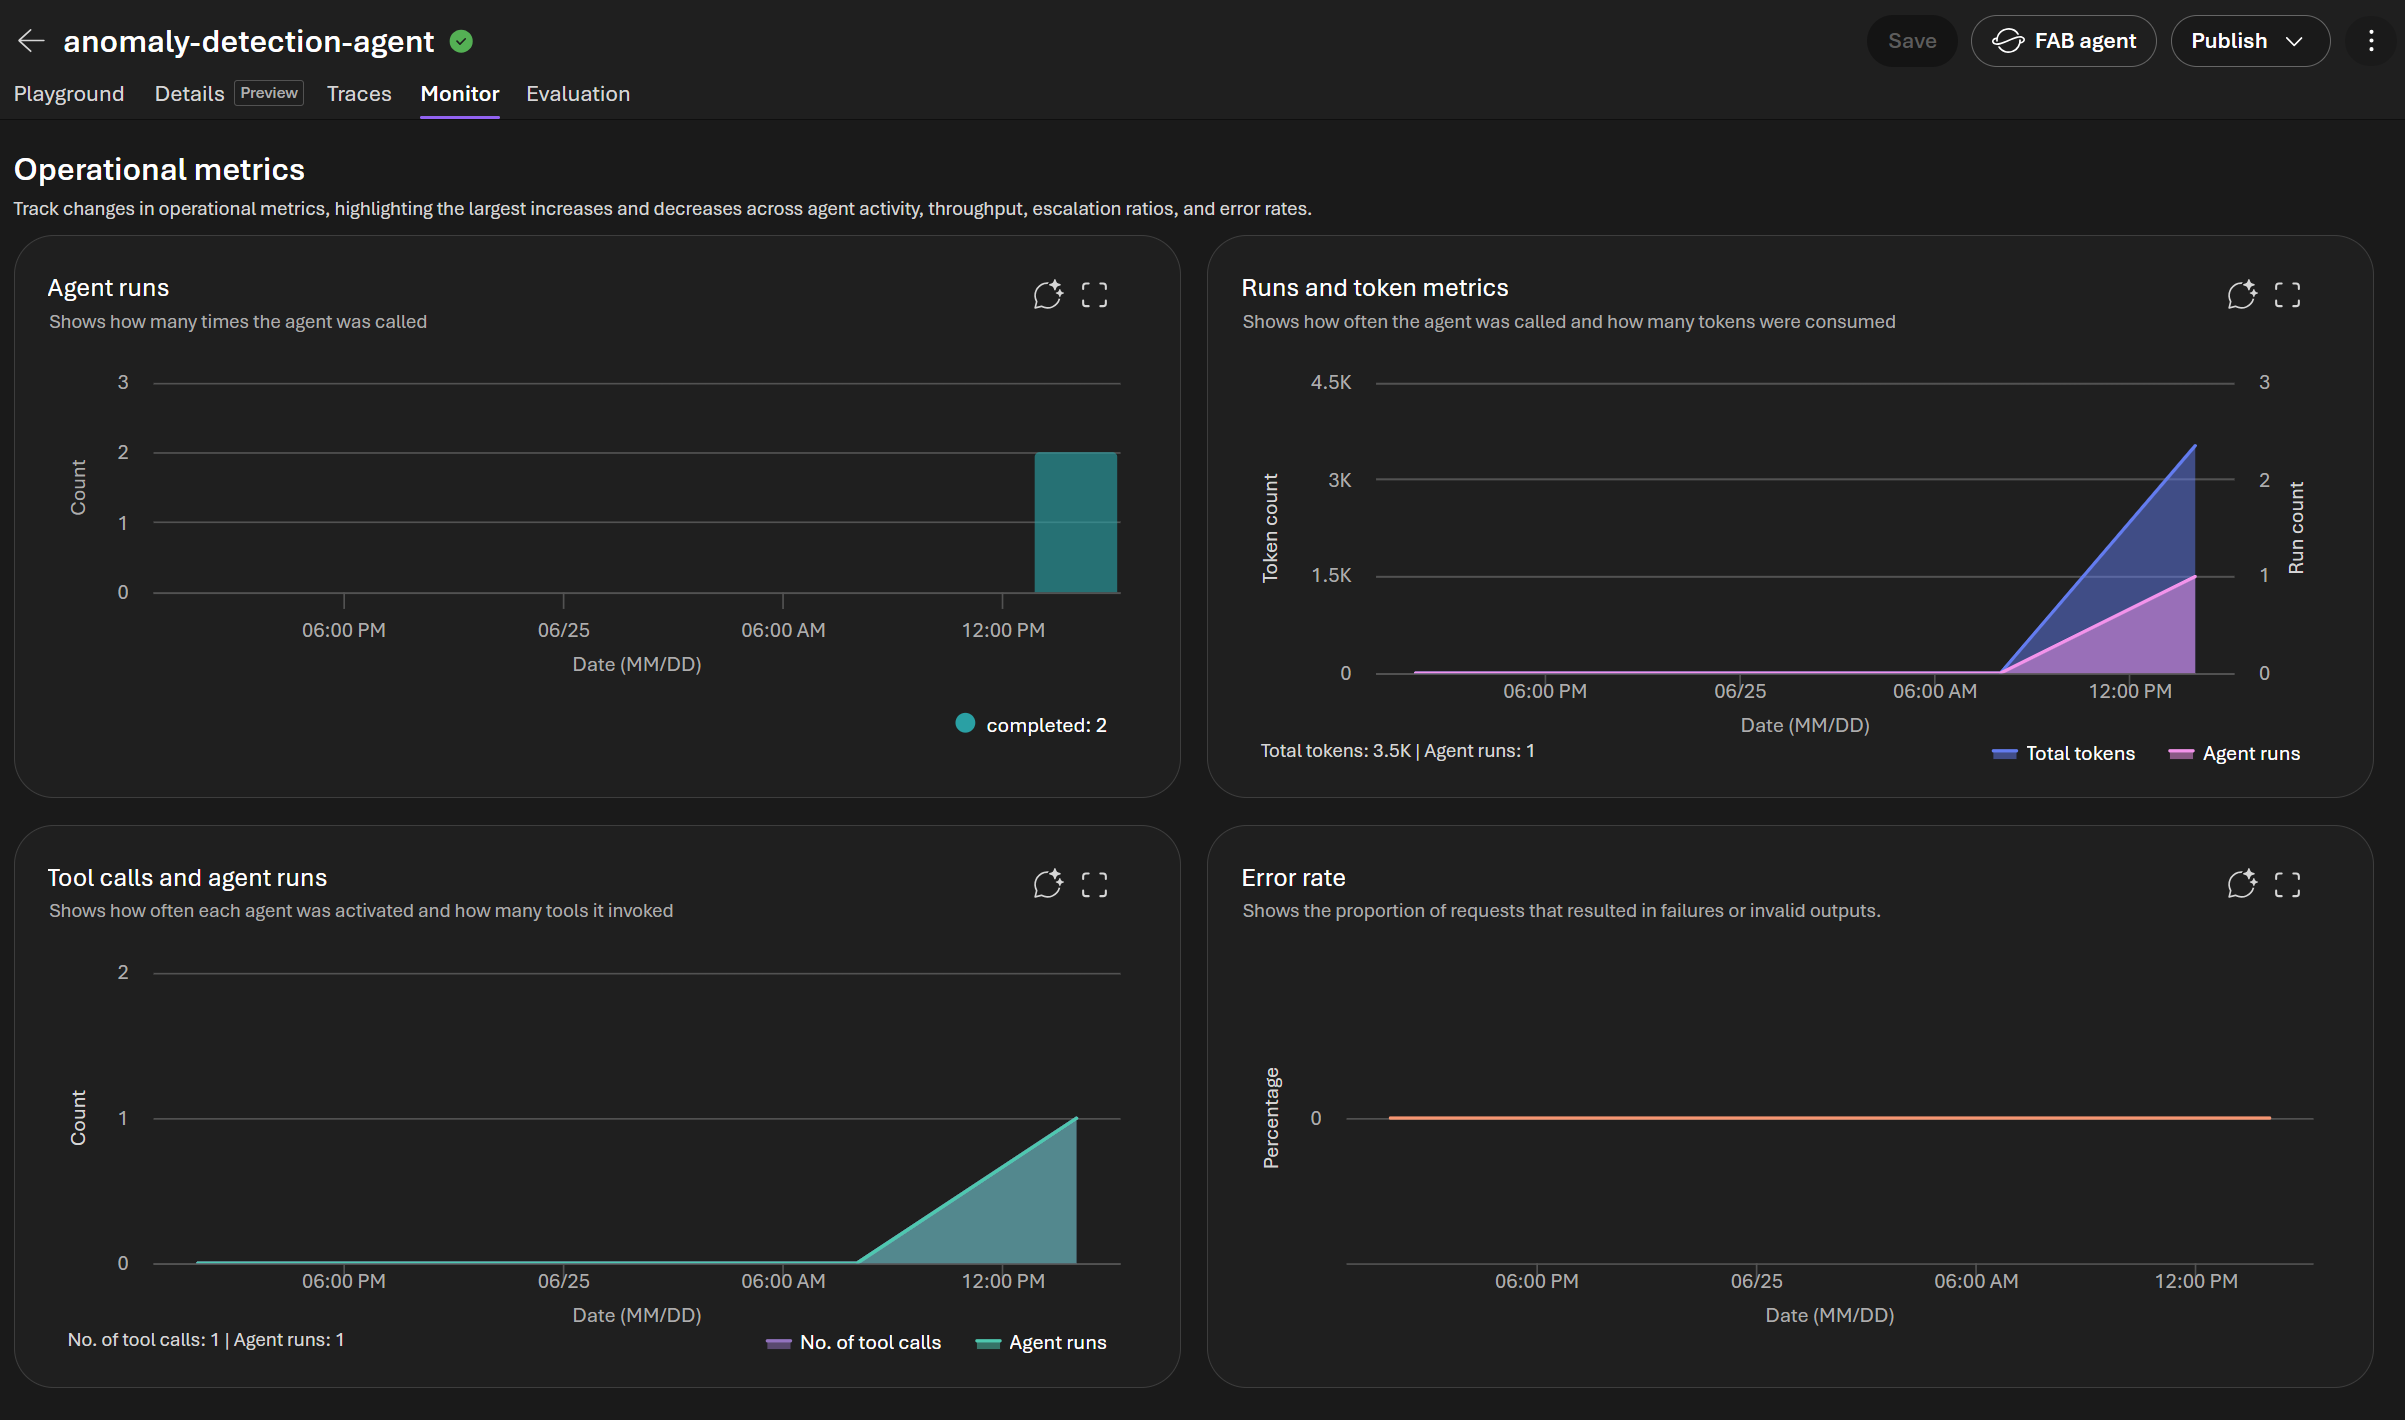
anomaly-detection-agent-> Monitor -
Monitor panel — The Overview tab gives an at-a-glance health summary with cards for Operational metrics (estimated cost and total token usage), Evaluations, Scheduled evaluations, and Scheduled red teaming run issues. Below, the Operational metrics charts plot Agent runs (how often the agent was called) and Runs and token metrics (calls vs. tokens consumed) over the selected time range. Use the Tools tab, date filters, Settings, or Open in Azure Monitor for deeper analysis.
Step 2 - Application Insights
- Go to portal.azure.com → search for Application Insights → open
foundry-hack-insights-<suffix> - Left sidebar → Investigate → Search
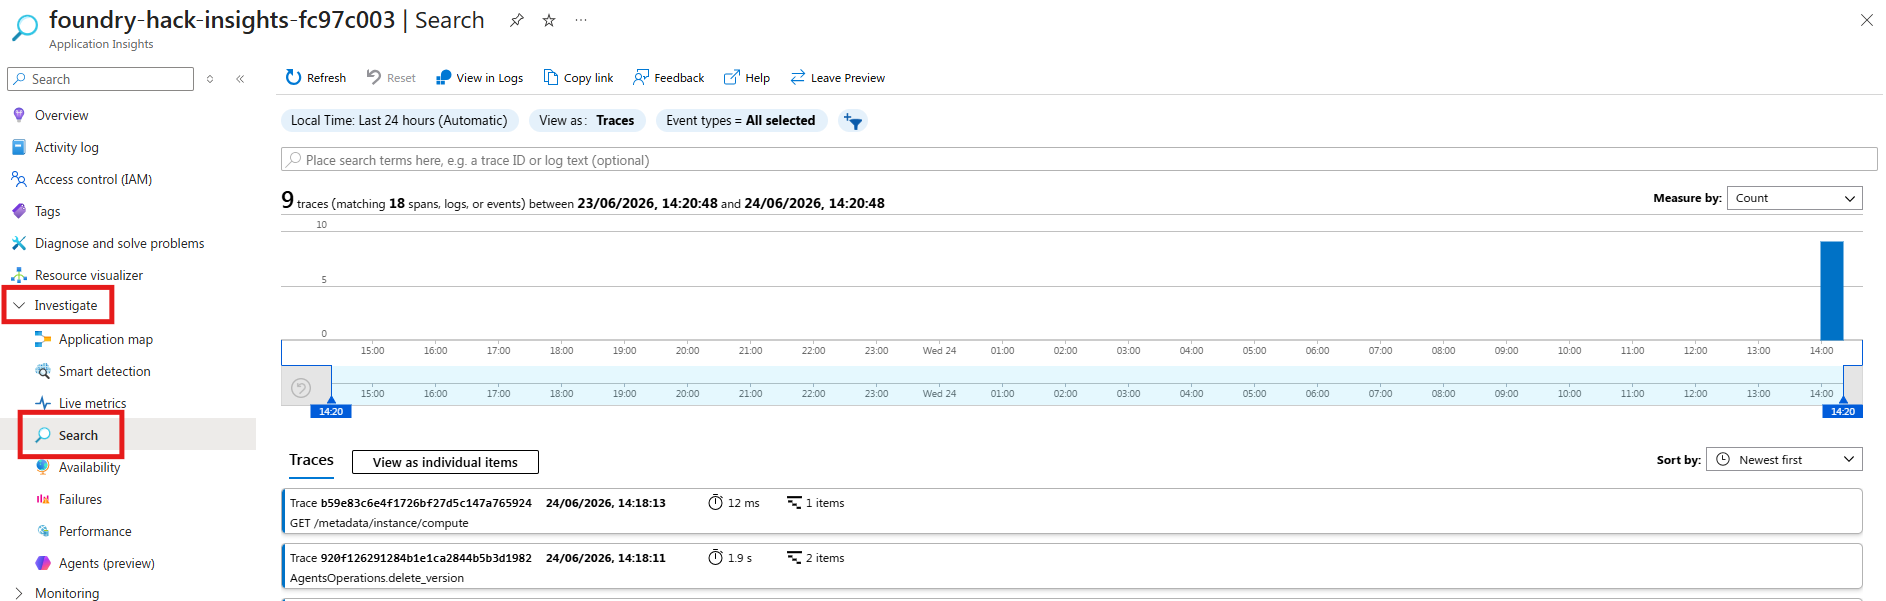
- Set the time range to Last 30 minutes and click Search — you'll see individual trace events
- Look for traces where your agents were invoked. You can inspect the timestamp, operation ID, and message payload to confirm calls reached the model.
- Click on
Anomaly Detection Agentinstance. You will see the end-to-end transaction trace showing: - The full agent conversation (user input with sensor anomalies → agent response with diagnosis)
- Nested spans for each model call with latency breakdowns (e.g.,
gpt-5.4-2026-03-05taking 5.1 seconds) - The exact system prompt and generated reasoning the agent used to reach its conclusion
- Resource details (AKS cluster, region) where the agent executed
- Any content filtering blockers that violated default Responsible AI standards
- This view lets you inspect exactly what the agent "saw" and "reasoned" to understand any misclassifications or performance issues
- In the left sidebar → Investigate → Agents (preview) to open the agent-centric operations dashboard.
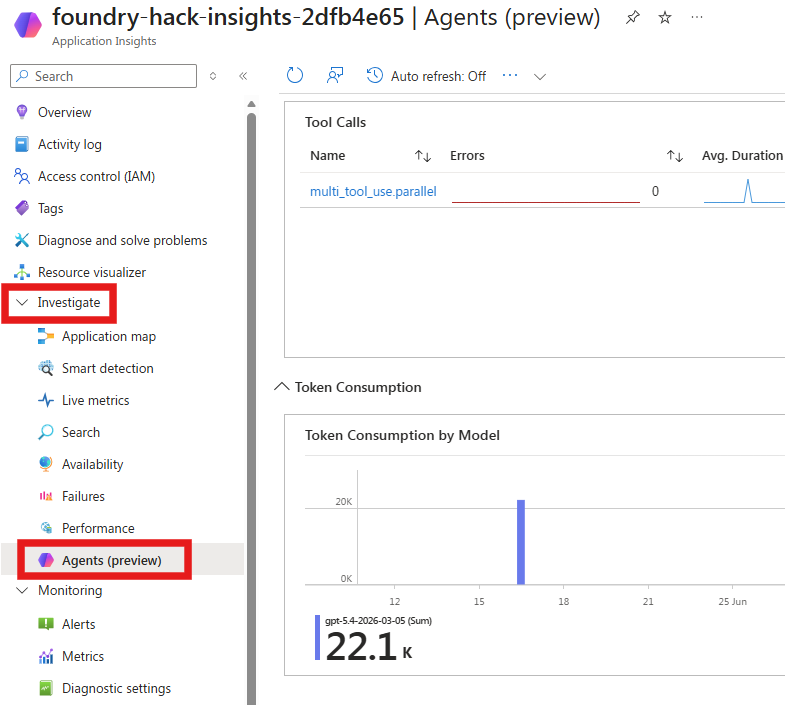
- Use the Time range and Agent filters at the top to scope the view, switch between the Dashboard and All agents tabs, or click Explore in Grafana for deeper analysis.
- Agent Operational Metrics:
- Agent Runs — total invocations broken down per agent (e.g.,
fault-diagnosis-agent,anomaly-detection-agent). Click View Traces with Agent Runs to jump to the underlying traces. - Gen AI Errors — surfaces any traces with GenAI errors in the selected window; a green check means none were found.
- Tool Calls — a table of each tool (e.g.,
multi_tool_use.parallel) with its error count, average duration, and number of calls, so you can spot slow or failing tools. - Models — per-model breakdown (e.g.,
gpt-5.4-2026-03-05,gpt-5.4) showing errors, average duration, and call counts.
- Agent Runs — total invocations broken down per agent (e.g.,
- Token Consumption:
- Token Consumption by Model — total tokens consumed per model (e.g., ~22.1K for
gpt-5.4-2026-03-05). - Input vs Output Tokens — input versus output token totals over time (e.g., 17K input vs 5.1K output), useful for tracking cost drivers.
- Token Consumption by Model — total tokens consumed per model (e.g., ~22.1K for
Success Criteria
- [ ] GenAI tracing is enabled and
monitor.pyran successfully - [ ] You can browse agent traces in the Foundry portal Traces view and open a conversation
- [ ] You can read the Monitor panel (agent runs, token usage, estimated cost)
- [ ] You can see at least one agent trace in Application Insights and open its end-to-end transaction trace
- [ ] You can use the Agents (preview) dashboard to view agent runs, tool calls, models, and token consumption
- [ ] You understand where to look when an agent misbehaves