Task 02 - Trace operations in Microsoft Foundry
Introduction
In the prior task, you looked at some of the default monitoring capabilities available in Microsoft Foundry. However, the information that is captured by default is at an aggregate level and may not tell the entire story. To gain deeper insights into model behavior and application performance, you can instrument your client application with the OpenTelemetry SDK. This will allow you to capture detailed trace information, including the actual messages that were sent to the model and the responses that were received. This information can be invaluable for diagnosing issues and optimizing model performance.
Description
In this task, you will trace operations in Microsoft Foundry by instrumenting your client application with the OpenTelemetry SDK. You will then generate some traffic to populate the Tracing dashboard for each agent with data. Finally, you will review the default application metrics available in the dashboard.
Success Criteria
- You have added instrumentation logic to your client application.
- You have generated traffic to populate the Tracing dashboard for agents.
Learning Resources
View trace results for AI applications using OpenAI SDK View trace results for AI agents in Microsoft Foundry
Key Tasks
01: Review existing trace details
Before you add any additional logic to the client application, first review the information that is currently available within Microsoft Foundry’s Tracing tab for agents.
Expand this section to view the solution
First, navigate to Microsoft Foundry and select the AI project associated with this training. Then, select Build from the main menu. Choose Agents from the left-hand side and then select one of your agents, such as the inventory-agent.
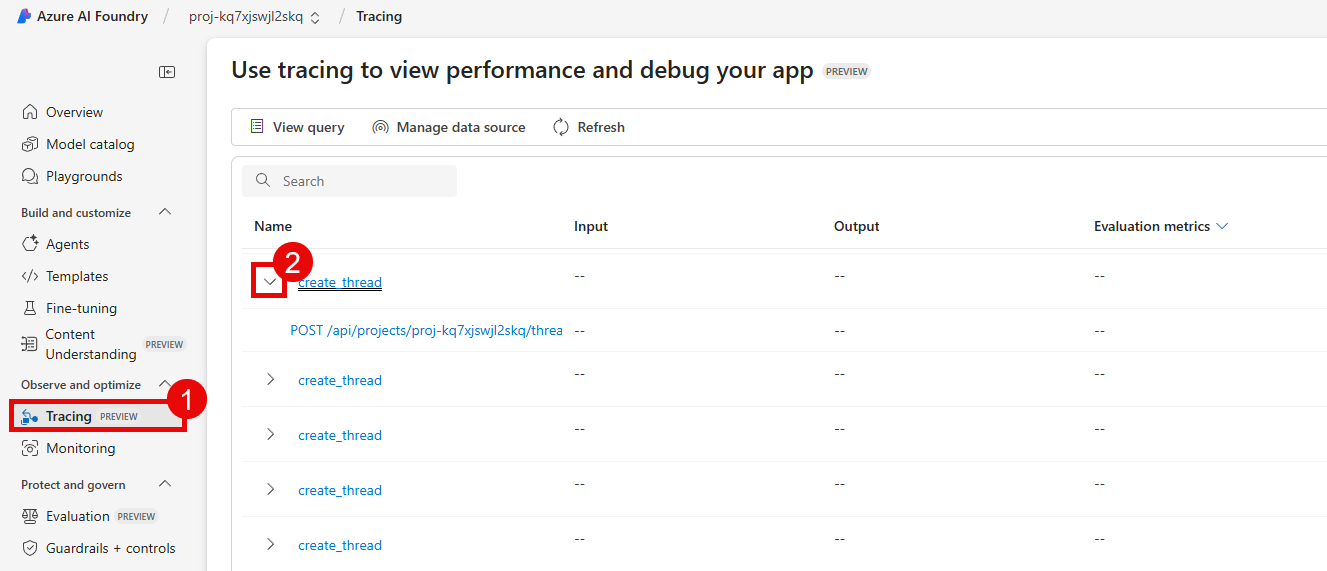
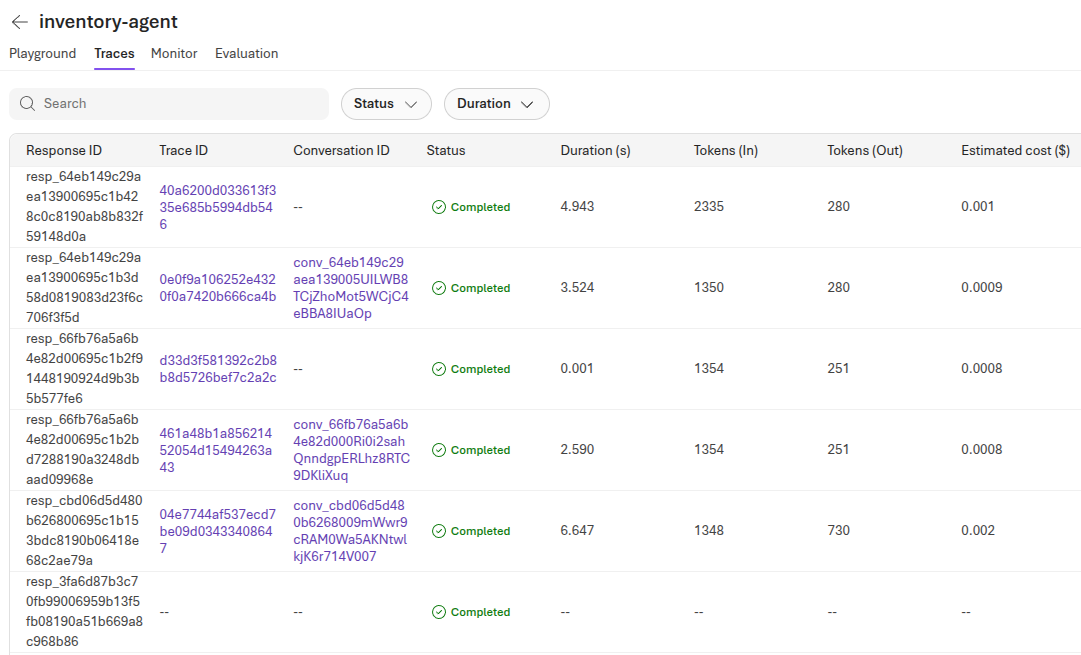
From there, select the Traces tab to view instances in which the agent was called.
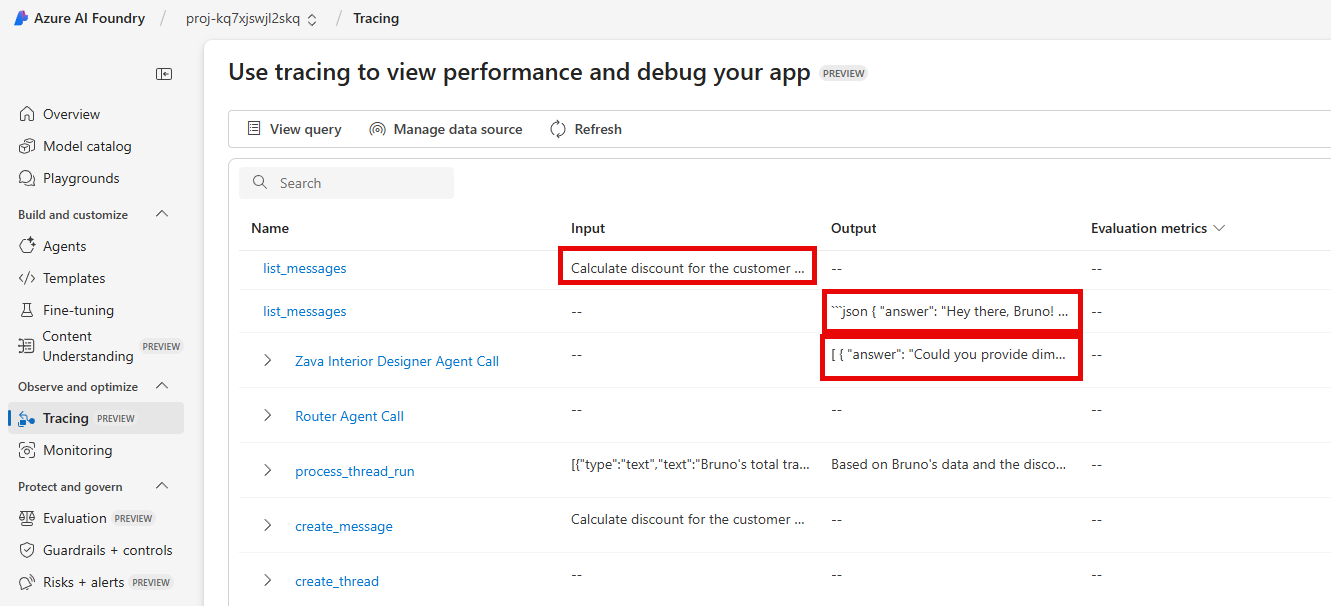
Select one of the conversations to view details on the trace.

In this example case, we spent 343 tokens to perform a lookup of stock quantities for the product whose ID is PROD0018. This agent performed a reasoning step and then needed to call the mcp_inventory_check() function to perform an inventory lookup. This trace is missing some relevant contextual information, such as the content of the response. This is because the client application has not been instrumented to capture this information.
02: Instrument the client application
As you saw in the first task, the Traces tab for agents in Microsoft Foundry contains some useful information about the operations that have occurred. However, it does not include any details about the responses that were received, or detailed information on duration, tokens, and estimated cost. To capture this information, you will need to add some instrumentation logic to your client application.
Expand this section to view the solution
First, open the src/chat_app.py file in your code editor. Then, uncomment the following import statement on line 14.
from opentelemetry.instrumentation.openai_v2 import OpenAIInstrumentor
On line 68, you will see a call to configure_azure_monitor(). This call enables telemetry collection and is why we see the information that we do in the Tracing menu. Immediately after this line (that is, on line 69), uncomment the following line of code to instrument OpenAI operations.
OpenAIInstrumentor().instrument()
Repeat this process in two more files: src/app/agents/agent_processor.py and src/app/tools/discountLogic.py. For agent_processor.py, uncomment lines 31 and 36. For discountLogic.py, uncomment lines 12 and 17.
Once you have made your changes, save the files and restart the application by stopping the Uvicorn server (Ctrl+C) and running the following command again.
uvicorn chat_app:app --host 0.0.0.0 --port 8000
03: Populate with additional data
Once you have updated the client application with the necessary instrumentation logic, you will need to generate some traffic to populate the Application analytics dashboard with data. Navigate back to your deployed application and interact with it to generate requests. Sample prompts may include the following:
- “What are the latest trends in home decor?”
- “Can you help me find a sofa that fits my style?”
- “Do you have any blue paint in stock?”
- “How much of PROD0043 do you have in stock?”
- “What is the availability of the ‘Modern Chair’?”
- “I am ready to check out.”
Enter a variety of prompts to generate different types of requests.
04: Review new trace details
As you interact with the application, new trace operations will be captured and sent to Microsoft Foundry. Navigate back to the Traces menu in Microsoft Foundry for the inventory agent to review the new trace details. If you do not see any new trace operations, refresh the page.
New trace operations that come in may now populate the Duration, Tokens (In), Tokens (Out) and Estimated cost columns in the grid. Furthermore, each trace has a Trace ID that you can select. This provides a detailed breakdown of what happened during a given conversation.
you can select a trace operation to view additional details, including the actual messages that were sent to the model and the responses that were received. This includes the system prompt and any user messages that were part of the conversation.
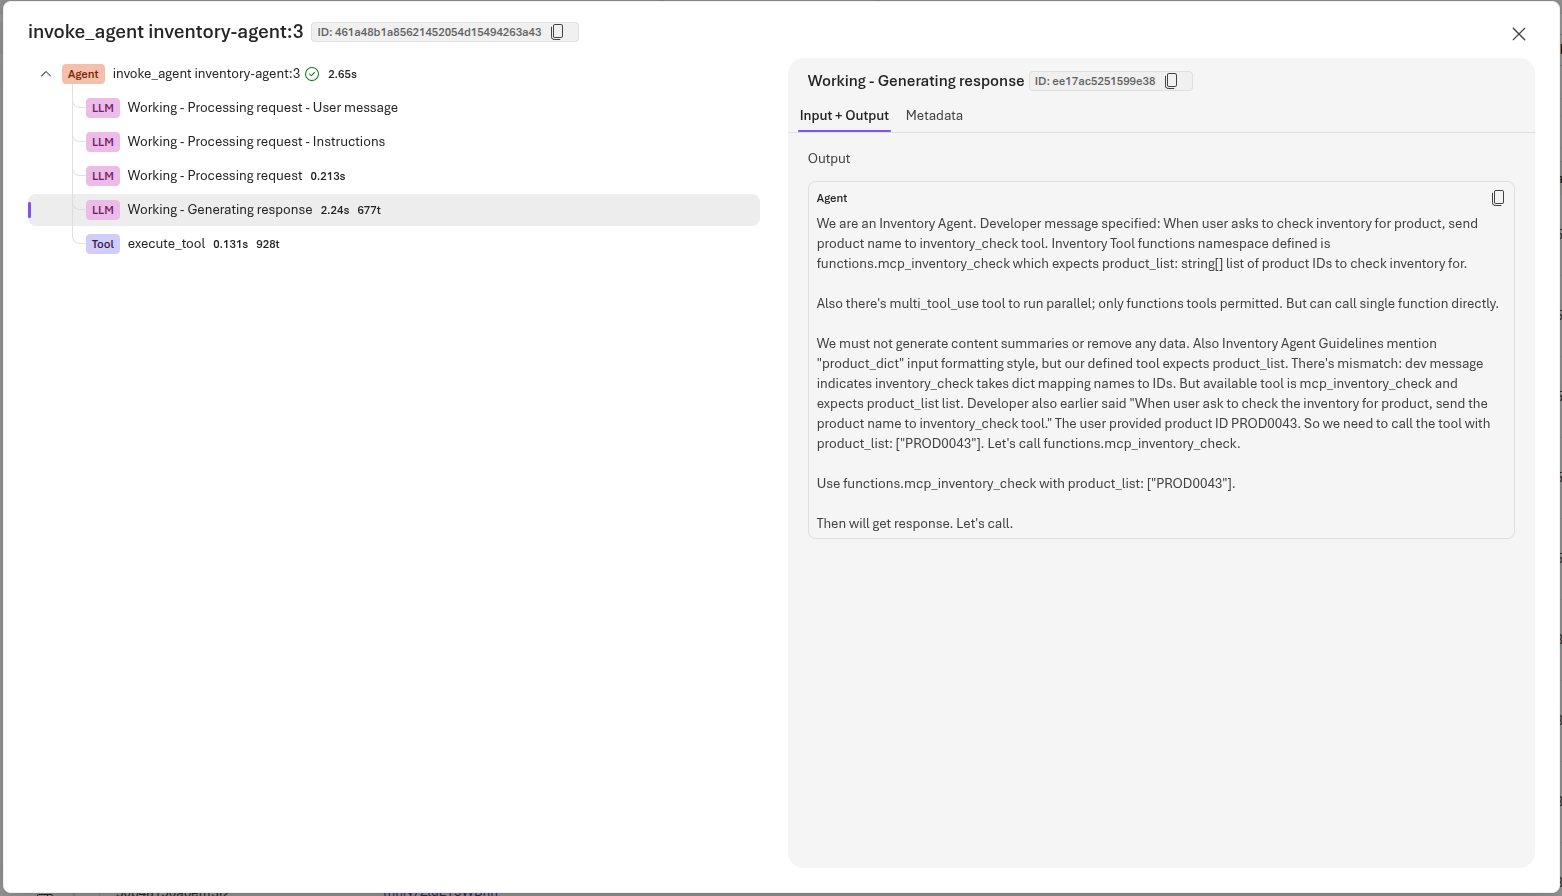
In the example above, this shows the output that the inventory agent emitted immediately before requesting invocation of the mcp_inventory_check() function for product code PROD0043.
05: Deploy to production
To conclude this task, you will deploy the latest version of the application to production. This will ensure that the instrumentation logic is included in the production environment and that you can continue to capture trace information for future requests.
Expand this section to view the solution
In order to deploy the latest version of the application to production, first ensure that all files are saved. Then, in the terminal, navigate to the src directory of your project if you are not already there. Stop the Uvicorn server if it is still running by pressing Ctrl+C. Then, build the Docker image for your Azure Container Registry by running the following command:
az acr build --registry {YOUR_ACR_NAME} --image chat-app:latest --platform linux/amd64 --file Dockerfile .
Then, update the Container App to deploy the new image revision:
az containerapp update \
  --name {YOUR_CONTAINER_APP_NAME} \
  --resource-group {YOUR_RESOURCE_GROUP} \
  --image {YOUR_REGISTRY_NAME}.azurecr.io/chat-app:latest
It may take a minute for the Container App to pull the new image and start the revision. Once the application is running, you can navigate to the FQDN of your Container App to access the chat application.
This particular way of deploying an application is not ideal. It requires you to have direct access to the production environment, which is not always feasible or secure. A better approach would be to use a CI/CD pipeline that automatically deploys the latest version of the application whenever changes are made to the codebase. This would ensure that the production environment is always up-to-date with the latest code and would reduce the risk of human error during the deployment process. This will be the main focus of Exercise 05.