TIP
🔥 Checkout the Azure Developer page at azure.com/developer (opens new window).
💡 Learn more : Application Change Analysis overview (opens new window).
📺 Watch the video : How to troubleshoot your applications with Change Analysis (opens new window).
# How to troubleshoot your applications with Change Analysis
# Troubleshoot applications with Application Change Analysis
Azure Monitor (opens new window) is a comprehensive Azure solution for collecting, analyzing, and acting on telemetry from your cloud and on-premises environments. It provides many features, including Application Insights (opens new window), Alerts (opens new window), and Application Change Analysis (opens new window). You can use Change Analysis to visualize infrastructure and application changes to troubleshoot issues. Change Analysis tracks changes of the properties of Azure resources, like VMs (opens new window) and App Service Web Apps (opens new window) and can even track changes in application files.
In this post, we'll use Application Change Analysis (opens new window) to visualize a configuration change of an App Service Web App (opens new window).
# Prerequisites
If you want to follow along, you'll need the following:
- An Azure subscription (If you don't have an Azure subscription, create a free account (opens new window) before you begin)
- An existing Azure App Service Web App (opens new window). Learn how to create one here (opens new window)
# Enable Change Analysis and visualize changes
Azure Application Change Analysis is enabled by default, so we don't have to create anything to use it. You can use it from various places in Azure resources, including from the "Diagnose and solve problems" menu of most Azure services. Let's try that by making a change and visualizing it.
- Go to the Azure portal (opens new window)
- Find an existing App Service Web App and navigate to it
- In the Web App, go to the "Diagnose and solve problems" menu. This is a high-level tool that enables you to start troubleshooting the Web App
- Click on the "Web App Down" link to drill down into the troubleshooting features
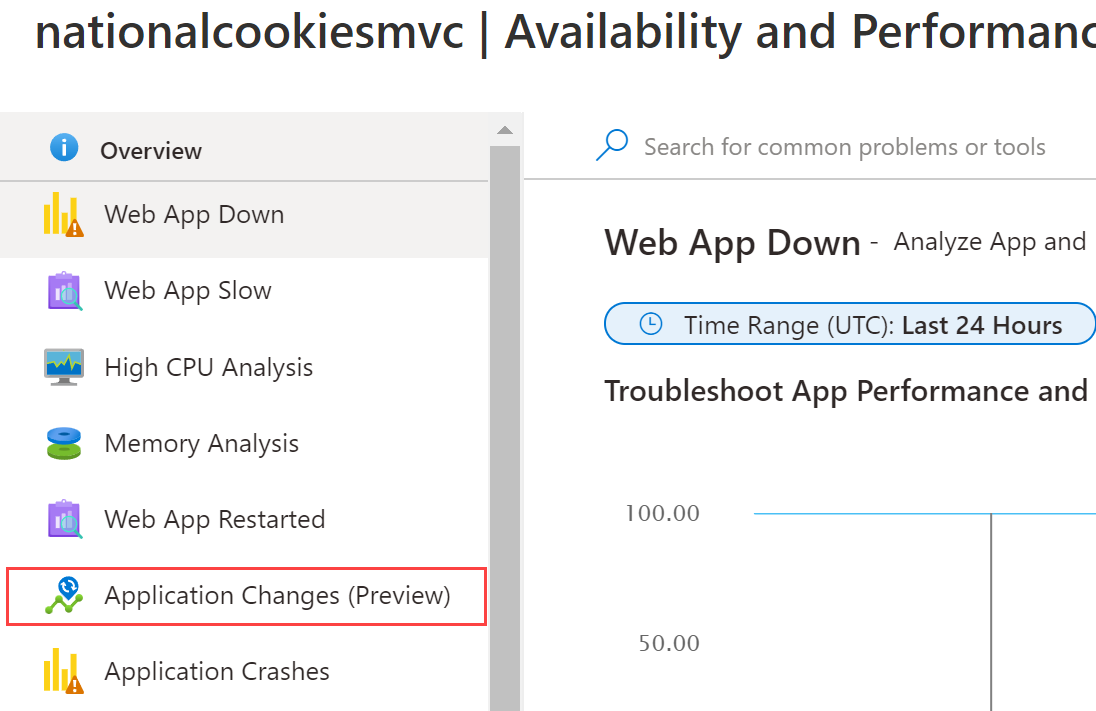
- Web App Down is one of the troubleshooting tools. In the menu on the left, you'll see many others, including Application Changes. Click on Application Changes

(Application Changes in an App Service Web App)
- This brings you to the Application Change Analysis page, filtered for the App Service Web App. This might show some changes that you made to the Web App in the last 24 hours (that is the default filter). You can also remove the filter for the Web App to see changes of other services

(The Application Change Analysis blade)
- Click the Configure button. This will show you the "Enable file and configuration change tracking" blade. Change Analysis can track multiple file and configuration types (opens new window)
(Enable file and configuration change tracking blade)
Enable tracking for the Web App and click Save
Now, let's make a change to the Web App. Go back to the App Service Web App
Click on the Configuration menu
Add or change a Connection string and click Save
Next, select the search box of the Azure portal and type "Change Analysis" and click on the result. This will open Application Change Analysis on a subscription level
You might see many changes. Find the change for the App Service Web App and click on it to see more details

(Details of the change)
That's it. We have now changed something in an Azure resource and visualized it with Application Change Analysis. This can be extremely useful when you are troubleshooting errors.
# Conclusion
Application Change Analysis (opens new window) is a feature of Azure Monitor that enables you to drill down into the details of application, configuration and infrastructure changes. This will help you troubleshoot errors in your solutions. Go and check it out!
