Task 03: Create a PowerBI report point to the semantic model (using direct lake mode)
With the model and relationships set up, create a Power BI report that points directly to the semantic model, utilizing Direct Query mode to access the data lake. This approach allows Contoso to generate real-time insights from their data, supporting dynamic decision-making processes and fostering a culture of informed strategy development across the organization.
-
On the menu above the canvas, select New report.
-
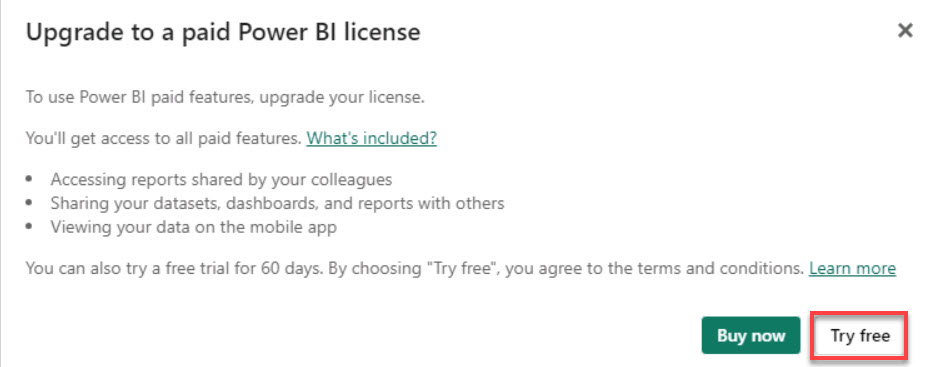
Once the Upgrade to Power BI Pro License message appears, select Try free.
-
In the All paid features of Power BI are yours for 60 days dialog box, select Got it.
-
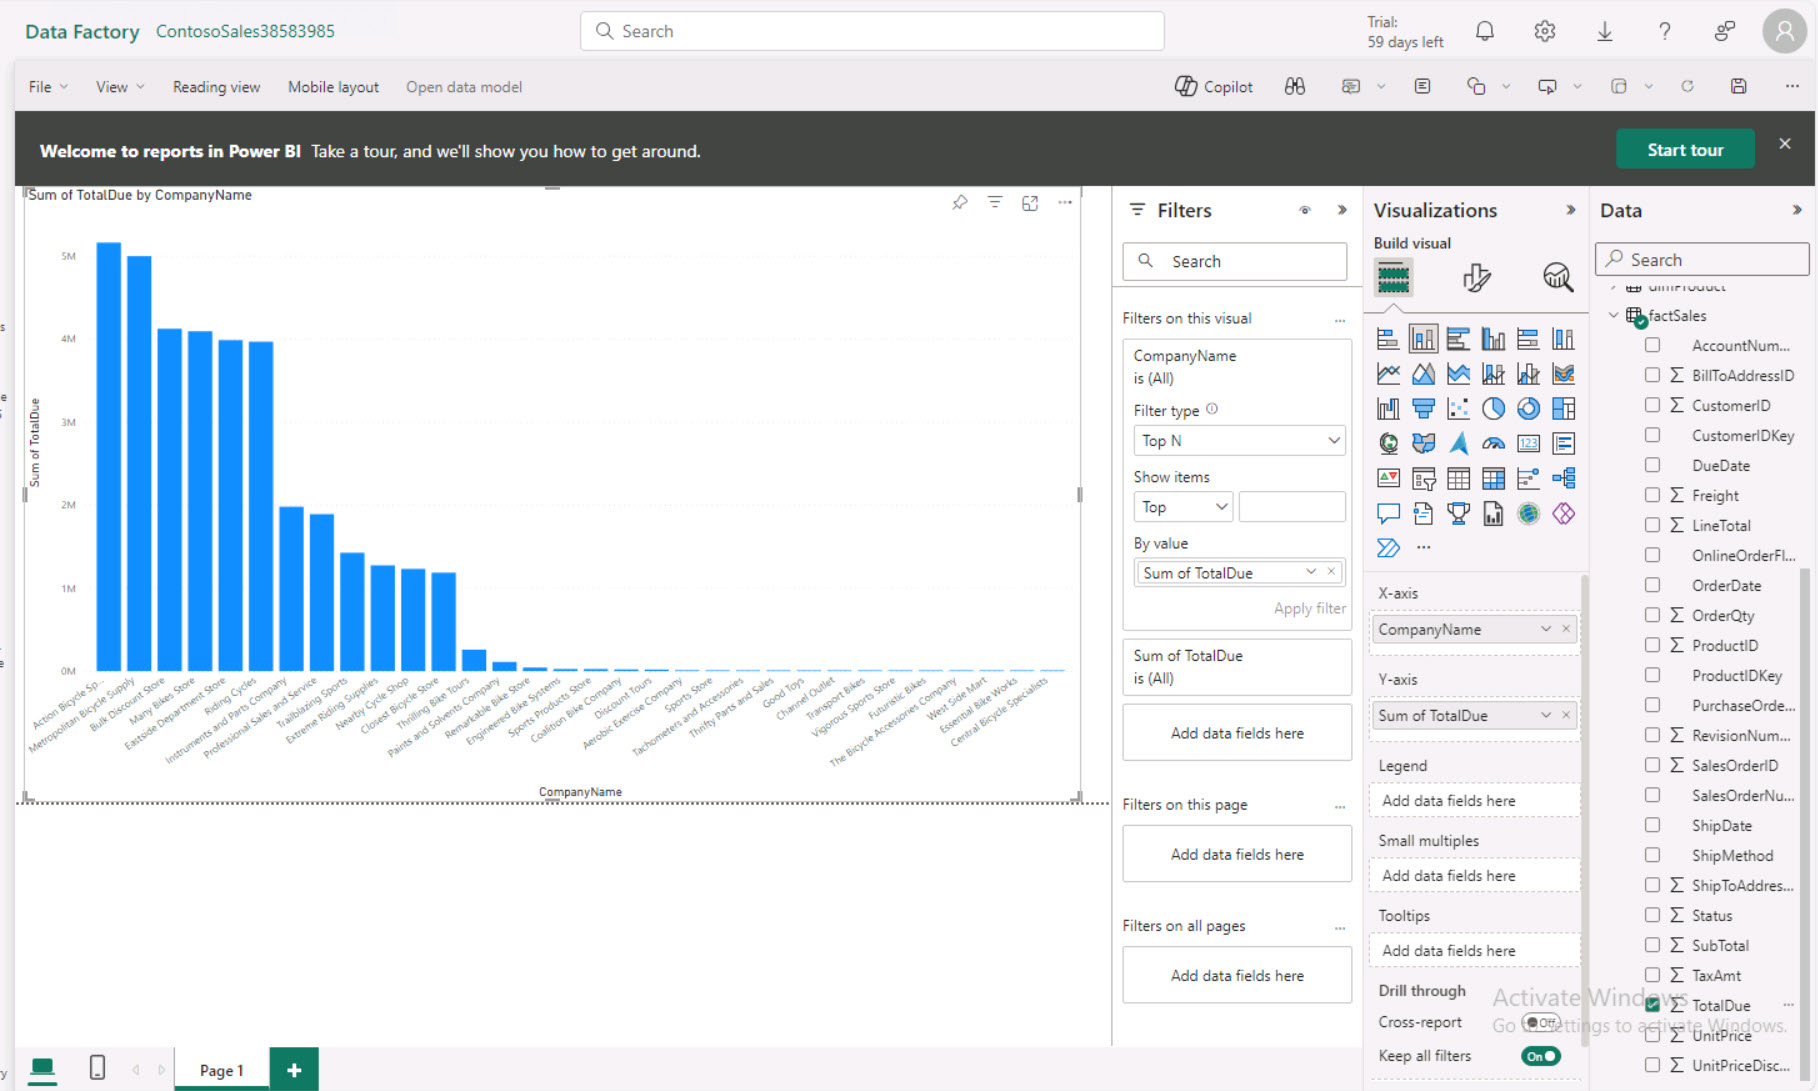
On the Visualizations pane, select the Stacked column chart.
 .
.You can drag the chart to expand its size or select Focus mode to make the visualization fill the pane.

-
On the Data pane, select the dimCustomer > CompanyName checkbox.
-
On the Data pane, select the factSales > TotalDue checkbox.
-
On the Filters pane, select the CompanyName is (All) filter card.
-
Select the Filter type menu and then select Top N.
-
In the Show items box, enter 10.
-
On the Data pane, select factSales > TotalDue and drag it to the By value box on the filter card.
-
On the Visualizations pane, under Build visual, select Format your Visual.
-
Select the General tab and then expand Title.
-
In the Text box enter Top 10 Customers.
These are the top 10 companies.
-
Try adding to this report on your own.
Add a report for the top 10 companies based on sales revenue and the top five products sold by each company.