Pass a data frame containing a group-to-group query and return a network
plot. Automatically handles "Collaborators_within_group" and
"Other_collaborators" within query data.
network_g2g(
  data,
  time_investor = NULL,
  collaborator = NULL,
  metric = "Collaboration_hours",
  algorithm = "fr",
  node_colour = "lightblue",
  exc_threshold = 0.1,
  org_count = NULL,
  subtitle = "Collaboration Across Organizations",
  return = "plot"
)

g2g_network(
  data,
  time_investor = NULL,
  collaborator = NULL,
  metric = "Collaboration_hours",
  algorithm = "fr",
  node_colour = "lightblue",
  exc_threshold = 0.1,
  org_count = NULL,
  subtitle = "Collaboration Across Organizations",
  return = "plot"
)
Arguments
- data
Data frame containing a G2G query.
- time_investor
String containing the variable name for the Time Investor column.
- collaborator
String containing the variable name for the Collaborator column.
- metric
String containing the variable name for metric. Defaults to
Collaboration_hours.- algorithm
String to specify the node placement algorithm to be used. Defaults to
"fr"for the force-directed algorithm of Fruchterman and Reingold. See https://rdrr.io/cran/ggraph/man/layout_tbl_graph_igraph.html for a full list of options.- node_colour
String or named vector to specify the colour to be used for displaying nodes. Defaults to
"lightblue".If
"vary"is supplied, a different colour is shown for each node at random.If a named vector is supplied, the names must match the values of the variable provided for the
time_investorandcollaboratorcolumns. See example section for details.
- exc_threshold
Numeric value between 0 and 1 specifying the exclusion threshold to apply. Defaults to 0.1, which means that the plot will only display collaboration above 10% of a node's total collaboration. This argument has no impact on
"data"or"table"return.- org_count
Optional data frame to provide the size of each organization in the
collaboratorattribute. The data frame should contain only two columns:Name of the
collaboratorattribute excluding any prefixes, e.g."Organization". Must be of character or factor type."n". Must be of numeric type. Defaults toNULL, where node sizes will be fixed.
- subtitle
String to override default plot subtitle.
- return
String specifying what to return. This must be one of the following strings:
"plot""table""network""data"
See
Valuefor more information.
Value
A different output is returned depending on the value passed to the return
argument:
"plot": 'ggplot' object. A group-to-group network plot."table": data frame. An interactive matrix of the network."network: 'igraph' object used for creating the network plot."data": data frame. A long table of the underlying data.
See also
Examples
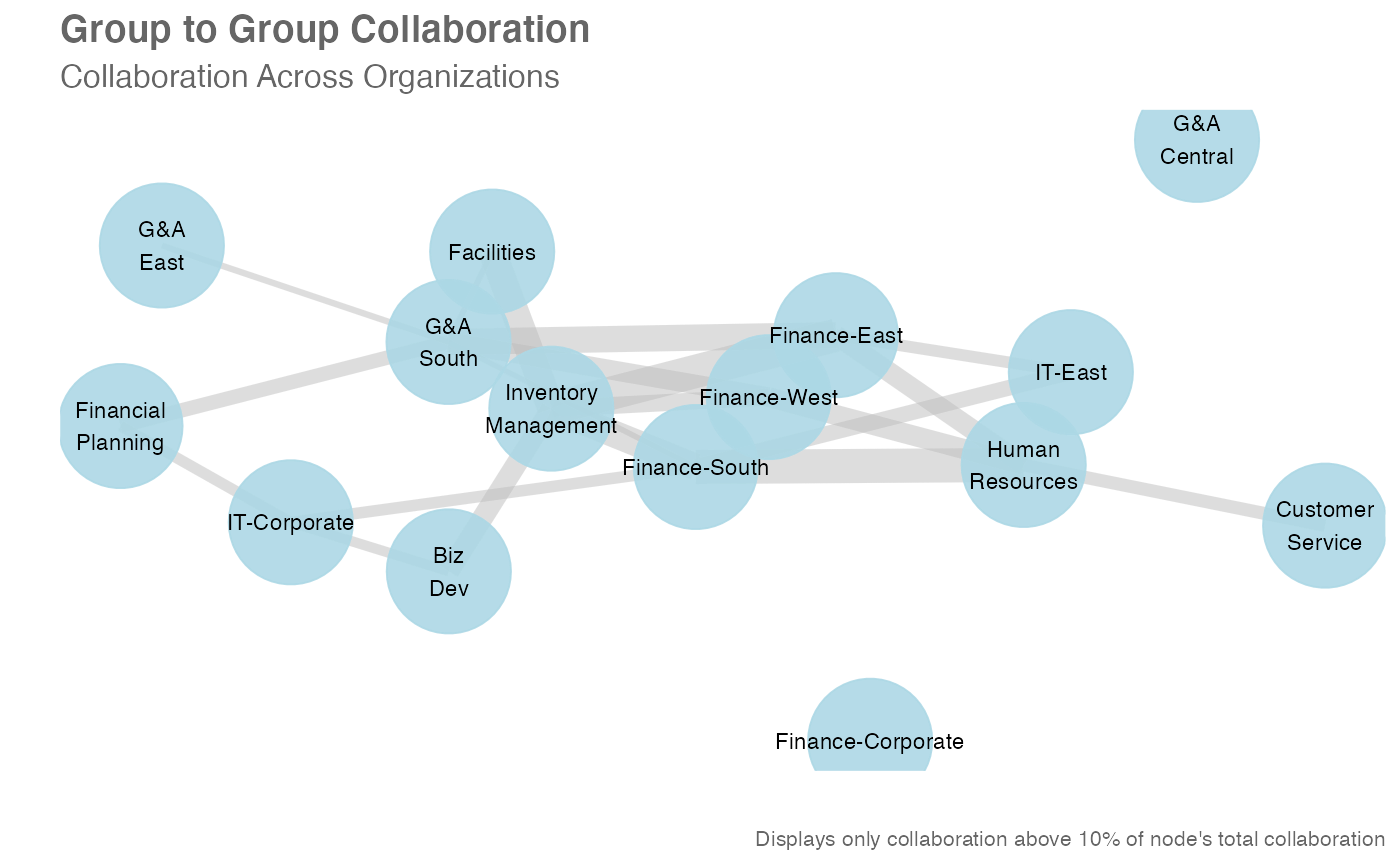
# Return a network plot
g2g_data %>% network_g2g()
#> `time_investor` field not provided. Assuming `TimeInvestors_Organization` as the `time_investor` variable.
#> `collaborator` field not provided. Assuming `Collaborators_Organization` as the `collaborator` variable.
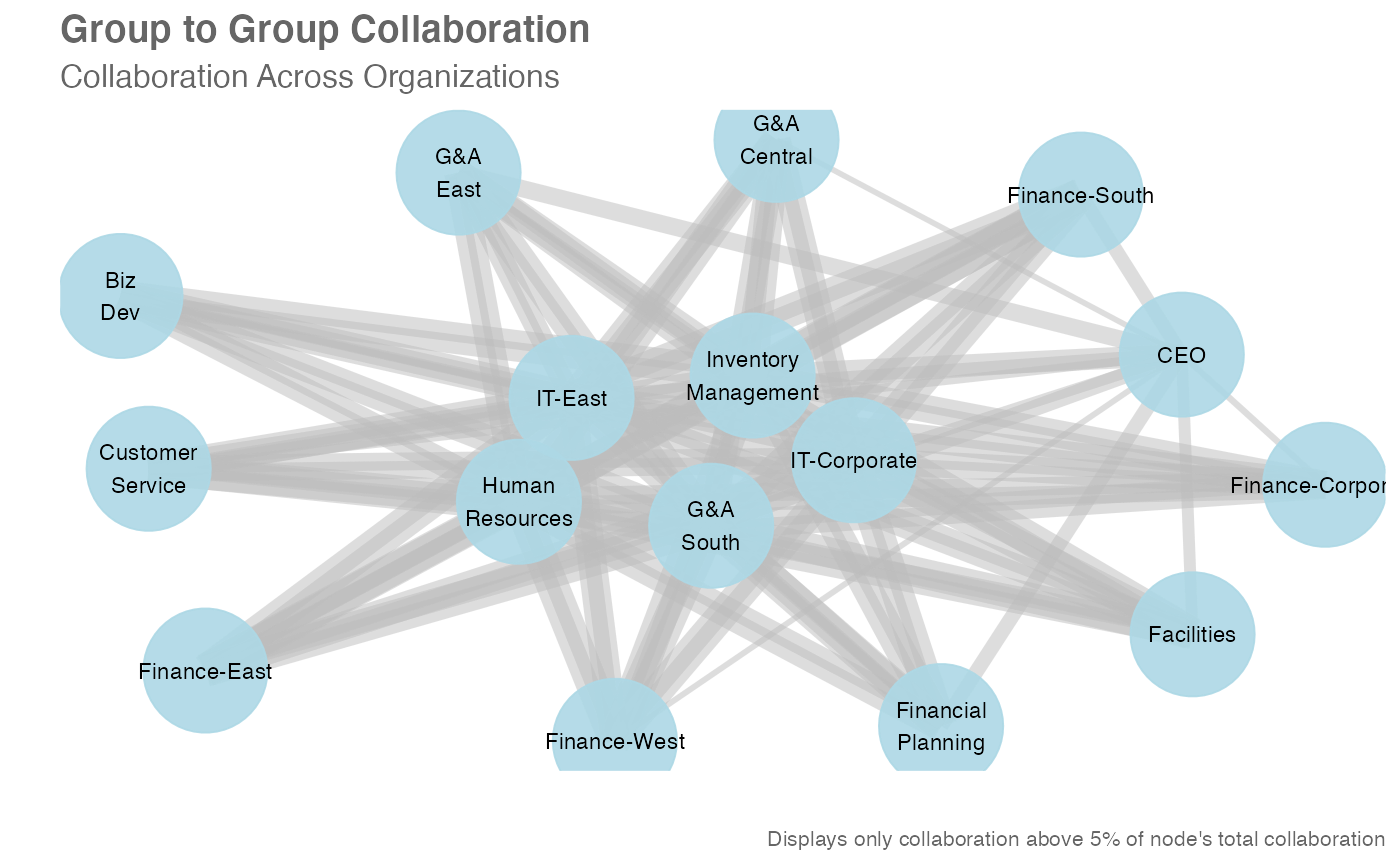
 # Return a network plot - Meeting hours and 5% threshold
g2g_data %>%
network_g2g(time_investor = "TimeInvestors_Organization",
collaborator = "Collaborators_Organization",
metric = "Meeting_hours",
exc_threshold = 0.05)
# Return a network plot - Meeting hours and 5% threshold
g2g_data %>%
network_g2g(time_investor = "TimeInvestors_Organization",
collaborator = "Collaborators_Organization",
metric = "Meeting_hours",
exc_threshold = 0.05)
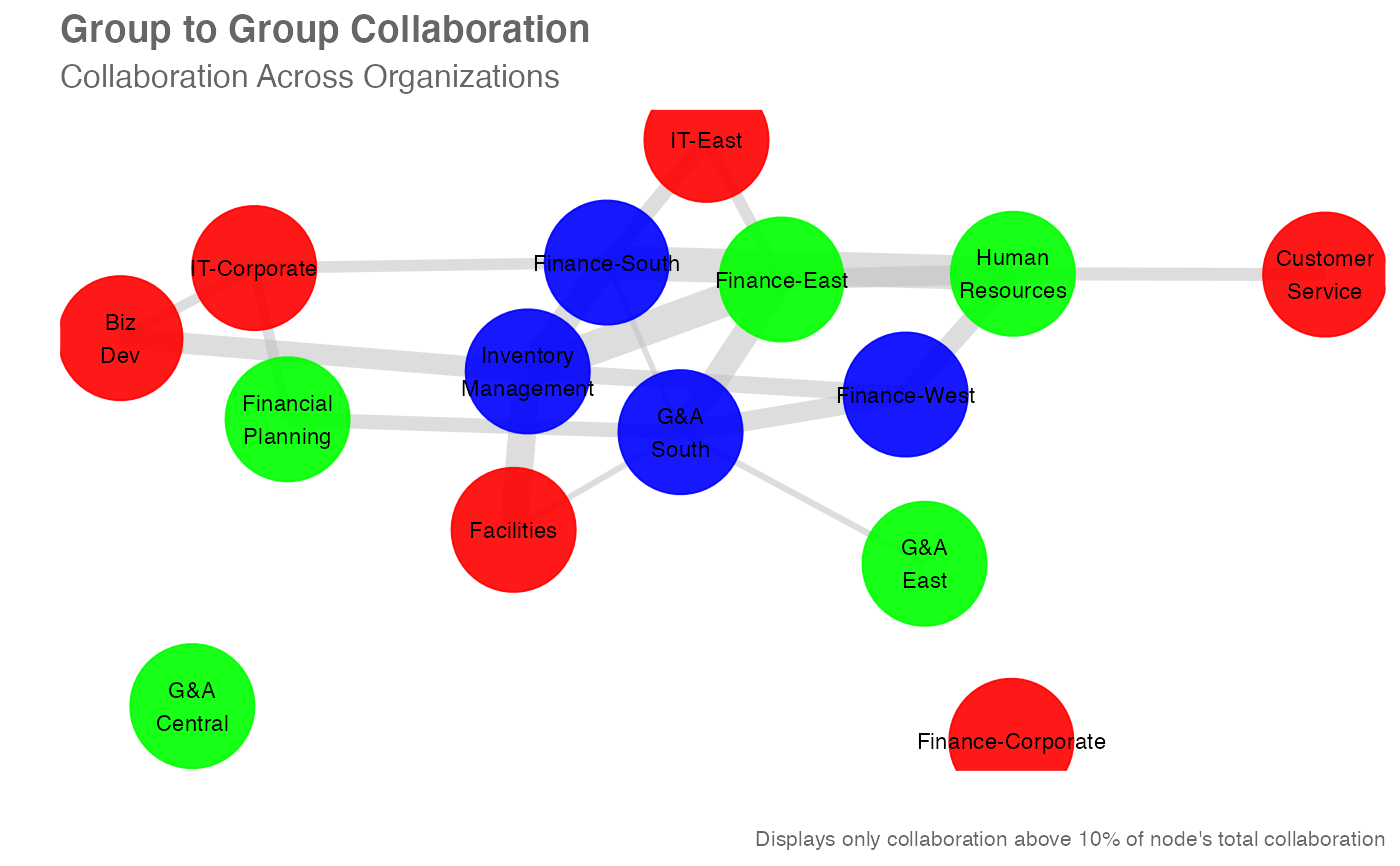
 # Return a network plot - custom-specific colours
# Get labels of orgs and assign random colours
org_str <- unique(g2g_data$TimeInvestors_Organization)
col_str <-
sample(
x = c("red", "green", "blue"),
size = length(org_str),
replace = TRUE
)
# Create and supply a named vector to `node_colour`
names(col_str) <- org_str
g2g_data %>%
network_g2g(node_colour = col_str)
#> `time_investor` field not provided. Assuming `TimeInvestors_Organization` as the `time_investor` variable.
#> `collaborator` field not provided. Assuming `Collaborators_Organization` as the `collaborator` variable.
# Return a network plot - custom-specific colours
# Get labels of orgs and assign random colours
org_str <- unique(g2g_data$TimeInvestors_Organization)
col_str <-
sample(
x = c("red", "green", "blue"),
size = length(org_str),
replace = TRUE
)
# Create and supply a named vector to `node_colour`
names(col_str) <- org_str
g2g_data %>%
network_g2g(node_colour = col_str)
#> `time_investor` field not provided. Assuming `TimeInvestors_Organization` as the `time_investor` variable.
#> `collaborator` field not provided. Assuming `Collaborators_Organization` as the `collaborator` variable.
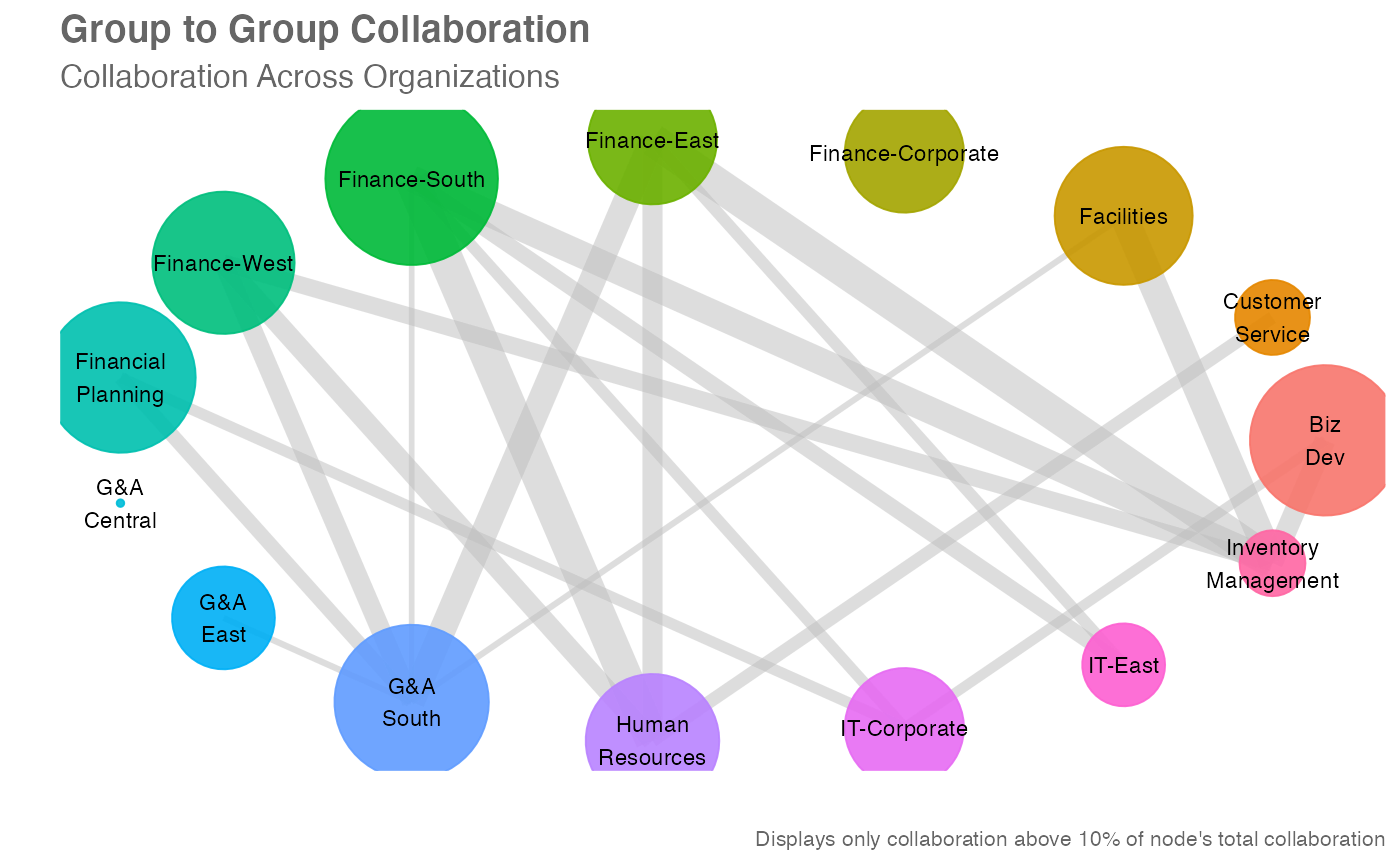
 # Return a network plot with circle layout
# Vary node colours and add org sizes
org_tb <- hrvar_count(
sq_data,
hrvar = "Organization",
return = "table"
)
g2g_data %>%
network_g2g(algorithm = "circle",
node_colour = "vary",
org_count = org_tb)
#> `time_investor` field not provided. Assuming `TimeInvestors_Organization` as the `time_investor` variable.
#> `collaborator` field not provided. Assuming `Collaborators_Organization` as the `collaborator` variable.
#> Warning: Removed 1 row containing missing values or values outside the scale range
#> (`geom_point()`).
# Return a network plot with circle layout
# Vary node colours and add org sizes
org_tb <- hrvar_count(
sq_data,
hrvar = "Organization",
return = "table"
)
g2g_data %>%
network_g2g(algorithm = "circle",
node_colour = "vary",
org_count = org_tb)
#> `time_investor` field not provided. Assuming `TimeInvestors_Organization` as the `time_investor` variable.
#> `collaborator` field not provided. Assuming `Collaborators_Organization` as the `collaborator` variable.
#> Warning: Removed 1 row containing missing values or values outside the scale range
#> (`geom_point()`).
 # Return an interaction matrix
# Minimum arguments specified
g2g_data %>%
network_g2g(return = "table")
#> `time_investor` field not provided. Assuming `TimeInvestors_Organization` as the `time_investor` variable.
#> `collaborator` field not provided. Assuming `Collaborators_Organization` as the `collaborator` variable.
#> # A tibble: 6 × 7
#> TimeInvestorOrg `Customer Service` Finance `Financial Planning`
#> <chr> <dbl> <dbl> <dbl>
#> 1 CEO 0.187 0.188 0.248
#> 2 Customer Service 0.715 0.00279 0.00255
#> 3 Finance 0.00597 0.370 0.00584
#> 4 Financial Planning 0.00327 0.00306 0.707
#> 5 Human Resources 0.102 0.108 0.0915
#> 6 IT 0.156 0.168 0.152
#> # ℹ 3 more variables: `Human Resources` <dbl>, IT <dbl>, CEO <dbl>
# Return an interaction matrix
# Minimum arguments specified
g2g_data %>%
network_g2g(return = "table")
#> `time_investor` field not provided. Assuming `TimeInvestors_Organization` as the `time_investor` variable.
#> `collaborator` field not provided. Assuming `Collaborators_Organization` as the `collaborator` variable.
#> # A tibble: 6 × 7
#> TimeInvestorOrg `Customer Service` Finance `Financial Planning`
#> <chr> <dbl> <dbl> <dbl>
#> 1 CEO 0.187 0.188 0.248
#> 2 Customer Service 0.715 0.00279 0.00255
#> 3 Finance 0.00597 0.370 0.00584
#> 4 Financial Planning 0.00327 0.00306 0.707
#> 5 Human Resources 0.102 0.108 0.0915
#> 6 IT 0.156 0.168 0.152
#> # ℹ 3 more variables: `Human Resources` <dbl>, IT <dbl>, CEO <dbl>