Plot Internal Network Breadth and Size as a scatter plot
Source:R/internal_network_plot.R
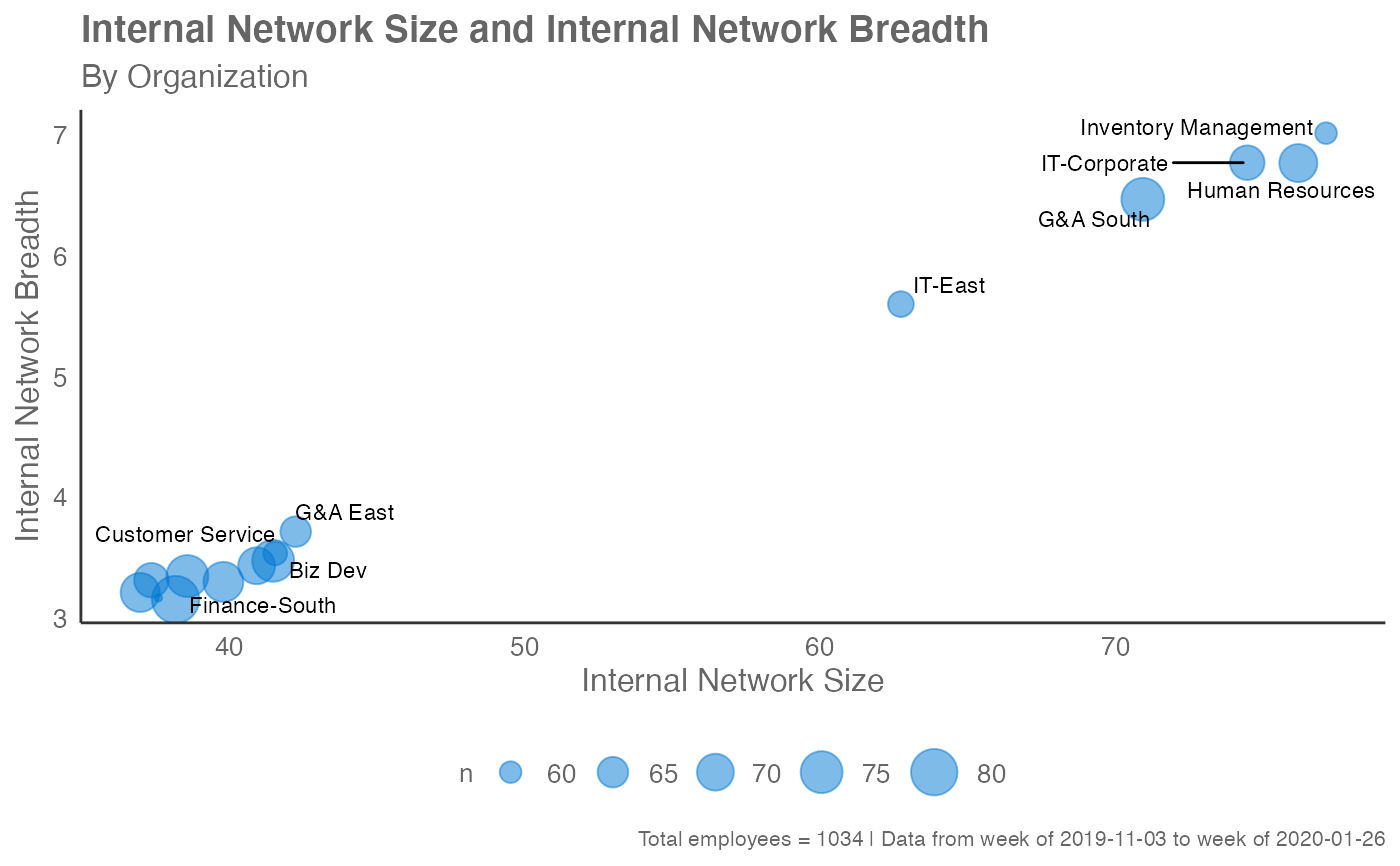
internal_network_plot.RdPlot the internal network metrics for a HR variable as a scatter plot, showing Internal Network Breadth as the vertical axis and Internal Network Size as the horizontal axis.
internal_network_plot(
  data,
  hrvar = "Organization",
  mingroup = 5,
  return = "plot",
  bubble_size = c(1, 8)
)
Arguments
- data
A Standard Person Query dataset in the form of a data frame.
- hrvar
HR Variable by which to split metrics, defaults to "Organization" but accepts any character vector, e.g. "LevelDesignation"
- mingroup
Numeric value setting the privacy threshold / minimum group size. Defaults to 5.
- return
String specifying what to return. This must be one of the following strings: -
"plot"-"table"- bubble_size
A numeric vector of length two to specify the size range of the bubbles
Value
'ggplot' object showing a bubble plot with internal network size as the x-axis and internal network breadth as the y-axis. The size of the bubbles represent the number of unique employees in each group.
Details
Uses the metrics Internal_network_size and
Networking_outside_organization.
See also
Other Visualization:
afterhours_dist(),
afterhours_fizz(),
afterhours_line(),
afterhours_rank(),
afterhours_summary(),
afterhours_trend(),
collaboration_area(),
collaboration_dist(),
collaboration_fizz(),
collaboration_line(),
collaboration_rank(),
collaboration_sum(),
collaboration_trend(),
create_bar(),
create_bar_asis(),
create_boxplot(),
create_bubble(),
create_dist(),
create_fizz(),
create_inc(),
create_line(),
create_line_asis(),
create_period_scatter(),
create_rank(),
create_sankey(),
create_scatter(),
create_stacked(),
create_tracking(),
create_trend(),
email_dist(),
email_fizz(),
email_line(),
email_rank(),
email_summary(),
email_trend(),
external_dist(),
external_fizz(),
external_line(),
external_network_plot(),
external_rank(),
external_sum(),
hr_trend(),
hrvar_count(),
hrvar_trend(),
keymetrics_scan(),
meeting_dist(),
meeting_fizz(),
meeting_line(),
meeting_quality(),
meeting_rank(),
meeting_summary(),
meeting_trend(),
meetingtype_dist(),
meetingtype_dist_ca(),
meetingtype_dist_mt(),
meetingtype_summary(),
mgrcoatt_dist(),
mgrrel_matrix(),
one2one_dist(),
one2one_fizz(),
one2one_freq(),
one2one_line(),
one2one_rank(),
one2one_sum(),
one2one_trend(),
period_change(),
workloads_dist(),
workloads_fizz(),
workloads_line(),
workloads_rank(),
workloads_summary(),
workloads_trend(),
workpatterns_area(),
workpatterns_rank()
Other Network:
external_network_plot(),
g2g_data,
network_describe(),
network_g2g(),
network_p2p(),
network_summary(),
p2p_data_sim()
Examples
# \donttest{
# Return plot
internal_network_plot(sq_data, return = "plot")


# Return summary table
internal_network_plot(sq_data, return = "table")
#> # A tibble: 5 × 4
#>   Organization       `Internal Network Size` `Internal Network Breadth`     n
#>   <chr>                                <dbl>                      <dbl> <int>
#> 1 Customer Service                      40.0                       3.53    61
#> 2 Finance                               37.7                       3.29   292
#> 3 Financial Planning                    37.1                       3.34    75
#> 4 Human Resources                       72.5                       6.76    71
#> 5 IT                                    67.4                       6.21   130
# }
# Return summary table
internal_network_plot(sq_data, return = "table")
#> # A tibble: 5 × 4
#> Organization `Internal Network Size` `Internal Network Breadth` n
#> <chr> <dbl> <dbl> <int>
#> 1 Customer Service 40.0 3.53 61
#> 2 Finance 37.7 3.29 292
#> 3 Financial Planning 37.1 3.34 75
#> 4 Human Resources 72.5 6.76 71
#> 5 IT 67.4 6.21 130
# }