Takes in an Hourly Collaboration query and returns a count table of working patterns, ranked from the most common to the least.
workpatterns_rank(
  data,
  signals = c("email", "IM"),
  start_hour = "0900",
  end_hour = "1700",
  top = 10,
  mode = "binary",
  return = "plot"
)
Arguments
- data
A data frame containing hourly collaboration data.
- signals
Character vector to specify which collaboration metrics to use:
"email"(default) for emails only"IM"for Teams messages only"unscheduled_calls"for Unscheduled Calls only"meetings"for Meetings onlyor a combination of signals, such as
c("email", "IM")
- start_hour
A character vector specifying starting hours, e.g. "
0900"- end_hour
A character vector specifying starting hours, e.g.
"1700"- top
numeric value specifying how many top working patterns to display in plot, e.g.
"10"- mode
string specifying aggregation method for plot. Valid options include:
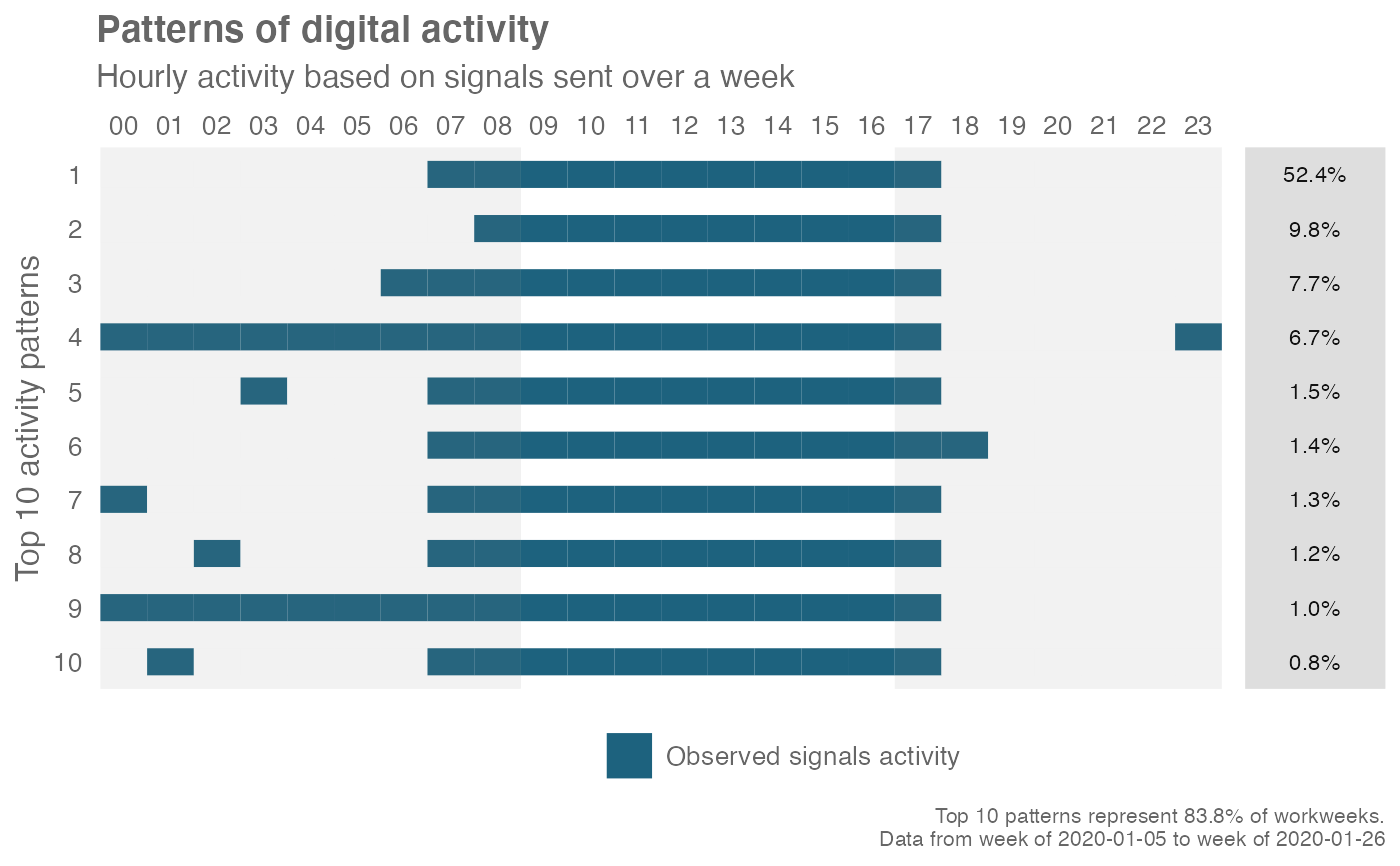
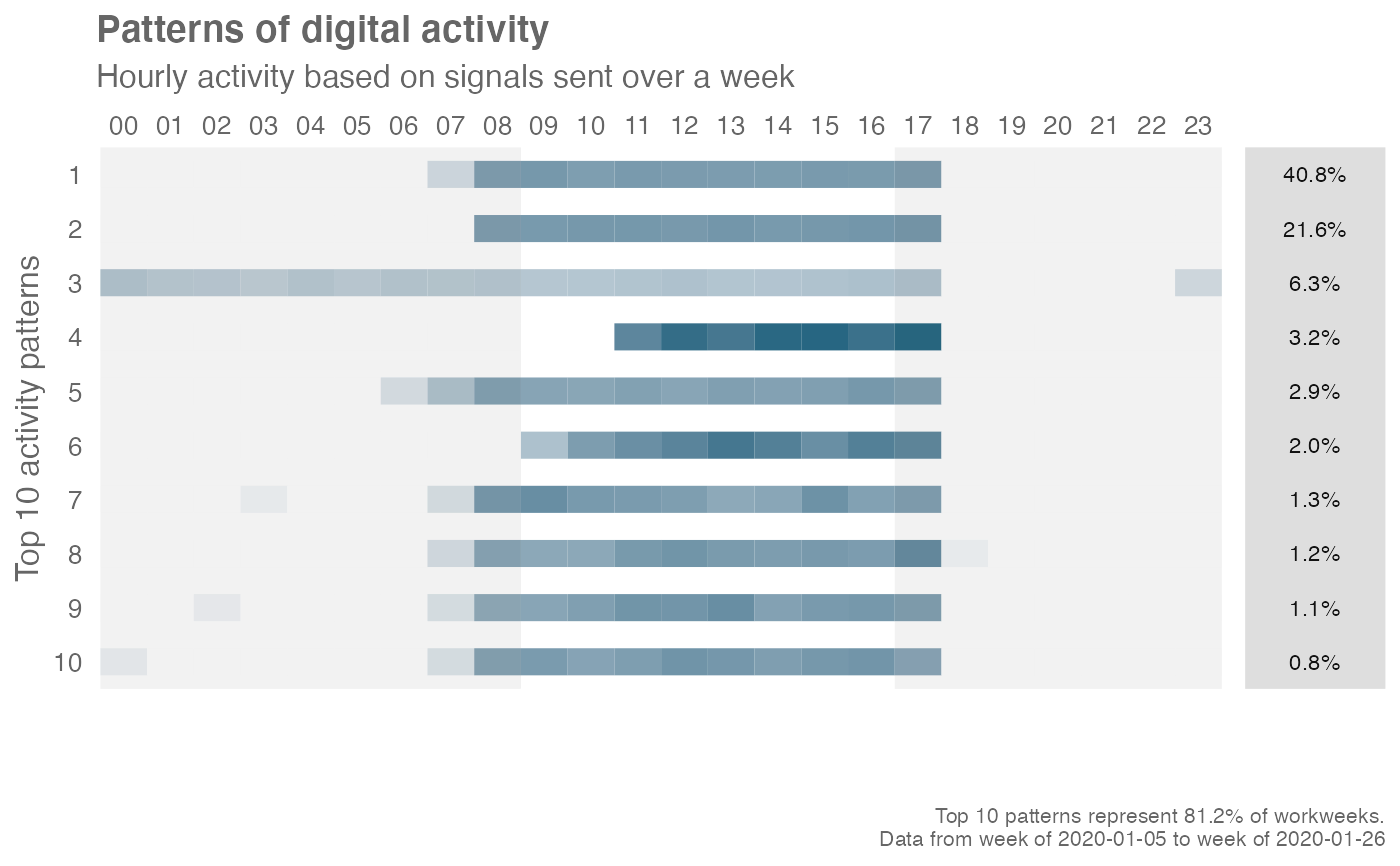
"binary": convert hourly activity into binary blocks. In the plot, each block would display as solid."prop": calculate proportion of signals in each hour over total signals across 24 hours, then average across all work weeks. In the plot, each block would display as a heatmap.
- return
String specifying what to return. This must be one of the following strings:
"plot""table"
See
Valuefor more information.
Value
A different output is returned depending on the value passed to the return
argument:
"plot": ggplot object. A plot with the y-axis showing the top ten working patterns and the x-axis representing each hour of the day."table": data frame. A summary table for the top working patterns.
See also
Other Visualization:
afterhours_dist(),
afterhours_fizz(),
afterhours_line(),
afterhours_rank(),
afterhours_summary(),
afterhours_trend(),
collaboration_area(),
collaboration_dist(),
collaboration_fizz(),
collaboration_line(),
collaboration_rank(),
collaboration_sum(),
collaboration_trend(),
create_bar(),
create_bar_asis(),
create_boxplot(),
create_bubble(),
create_dist(),
create_fizz(),
create_inc(),
create_line(),
create_line_asis(),
create_period_scatter(),
create_rank(),
create_sankey(),
create_scatter(),
create_stacked(),
create_tracking(),
create_trend(),
email_dist(),
email_fizz(),
email_line(),
email_rank(),
email_summary(),
email_trend(),
external_dist(),
external_fizz(),
external_line(),
external_network_plot(),
external_rank(),
external_sum(),
hr_trend(),
hrvar_count(),
hrvar_trend(),
internal_network_plot(),
keymetrics_scan(),
meeting_dist(),
meeting_fizz(),
meeting_line(),
meeting_quality(),
meeting_rank(),
meeting_summary(),
meeting_trend(),
meetingtype_dist(),
meetingtype_dist_ca(),
meetingtype_dist_mt(),
meetingtype_summary(),
mgrcoatt_dist(),
mgrrel_matrix(),
one2one_dist(),
one2one_fizz(),
one2one_freq(),
one2one_line(),
one2one_rank(),
one2one_sum(),
one2one_trend(),
period_change(),
workloads_dist(),
workloads_fizz(),
workloads_line(),
workloads_rank(),
workloads_summary(),
workloads_trend(),
workpatterns_area()
Other Working Patterns:
flex_index(),
identify_shifts(),
identify_shifts_wp(),
plot_flex_index(),
workpatterns_area(),
workpatterns_classify(),
workpatterns_classify_bw(),
workpatterns_classify_pav(),
workpatterns_hclust(),
workpatterns_report()
Examples
# \donttest{
# Plot by default
workpatterns_rank(
data = em_data,
signals = c(
"email",
"IM",
"unscheduled_calls",
"meetings"
)
)
 # Plot with prop / heatmap mode
workpatterns_rank(
data = em_data,
mode = "prop"
)
# Plot with prop / heatmap mode
workpatterns_rank(
data = em_data,
mode = "prop"
)
 # }
# }