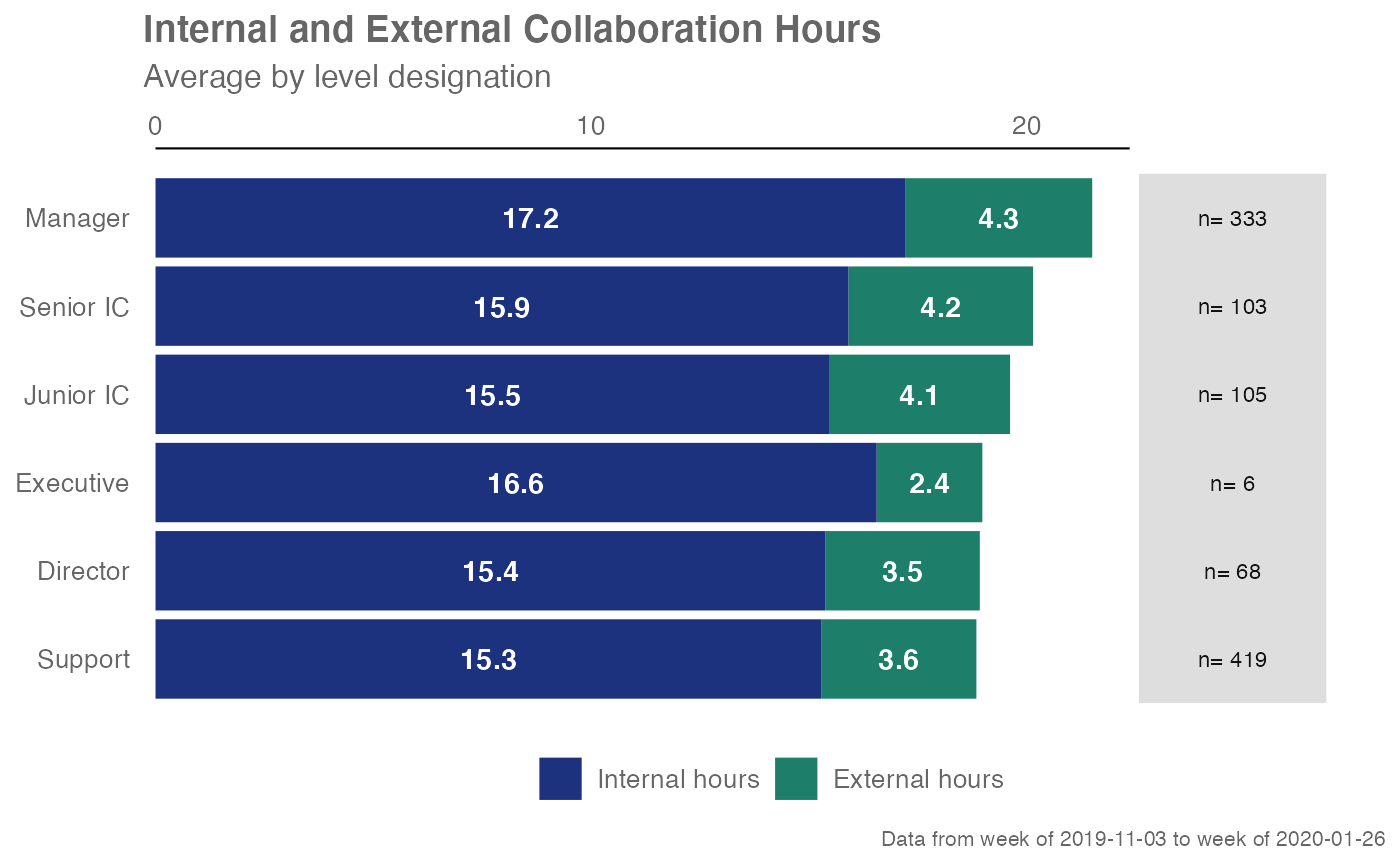
Provides an overview analysis of 'External Collaboration'. Returns a stacked bar plot of internal and external collaboration. Additional options available to return a summary table.
Arguments
- data
A Standard Person Query dataset in the form of a data frame.
- hrvar
String containing the name of the HR Variable by which to split metrics. Defaults to
"Organization". To run the analysis on the total instead of splitting by an HR attribute, supplyNULL(without quotes).- mingroup
Numeric value setting the privacy threshold / minimum group size. Defaults to 5.
- stack_colours
A character vector to specify the colour codes for the stacked bar charts.
- return
Character vector specifying what to return, defaults to "plot". Valid inputs are "plot" and "table".
Value
Returns a 'ggplot' object by default, where 'plot' is passed in return.
When 'table' is passed, a summary table is returned as a data frame.
See also
Other Visualization:
afterhours_dist(),
afterhours_fizz(),
afterhours_line(),
afterhours_rank(),
afterhours_summary(),
afterhours_trend(),
collaboration_area(),
collaboration_dist(),
collaboration_fizz(),
collaboration_line(),
collaboration_rank(),
collaboration_sum(),
collaboration_trend(),
create_bar(),
create_bar_asis(),
create_boxplot(),
create_bubble(),
create_dist(),
create_fizz(),
create_inc(),
create_line(),
create_line_asis(),
create_period_scatter(),
create_rank(),
create_sankey(),
create_scatter(),
create_stacked(),
create_tracking(),
create_trend(),
email_dist(),
email_fizz(),
email_line(),
email_rank(),
email_summary(),
email_trend(),
external_dist(),
external_fizz(),
external_line(),
external_network_plot(),
external_rank(),
hr_trend(),
hrvar_count(),
hrvar_trend(),
internal_network_plot(),
keymetrics_scan(),
meeting_dist(),
meeting_fizz(),
meeting_line(),
meeting_quality(),
meeting_rank(),
meeting_summary(),
meeting_trend(),
meetingtype_dist(),
meetingtype_dist_ca(),
meetingtype_dist_mt(),
meetingtype_summary(),
mgrcoatt_dist(),
mgrrel_matrix(),
one2one_dist(),
one2one_fizz(),
one2one_freq(),
one2one_line(),
one2one_rank(),
one2one_sum(),
one2one_trend(),
period_change(),
workloads_dist(),
workloads_fizz(),
workloads_line(),
workloads_rank(),
workloads_summary(),
workloads_trend(),
workpatterns_area(),
workpatterns_rank()
Other External Collaboration:
external_dist(),
external_fizz(),
external_line()
Examples
# Return a plot
external_sum(sq_data, hrvar = "LevelDesignation")


# Return summary table
external_sum(sq_data, hrvar = "LevelDesignation", return = "table")
#> # A tibble: 5 × 5
#>   group     Internal_hours External_hours Total Employee_Count
#>   <chr>              <dbl>          <dbl> <dbl>          <int>
#> 1 Director            15.1           3.49  18.6             43
#> 2 Junior IC           15.9           4.65  20.6             58
#> 3 Manager             17.9           4.92  22.8            200
#> 4 Senior IC           16.7           4.70  21.4             67
#> 5 Support             15.5           3.72  19.3            257
# Return summary table
external_sum(sq_data, hrvar = "LevelDesignation", return = "table")
#> # A tibble: 5 × 5
#> group Internal_hours External_hours Total Employee_Count
#> <chr> <dbl> <dbl> <dbl> <int>
#> 1 Director 15.1 3.49 18.6 43
#> 2 Junior IC 15.9 4.65 20.6 58
#> 3 Manager 17.9 4.92 22.8 200
#> 4 Senior IC 16.7 4.70 21.4 67
#> 5 Support 15.5 3.72 19.3 257