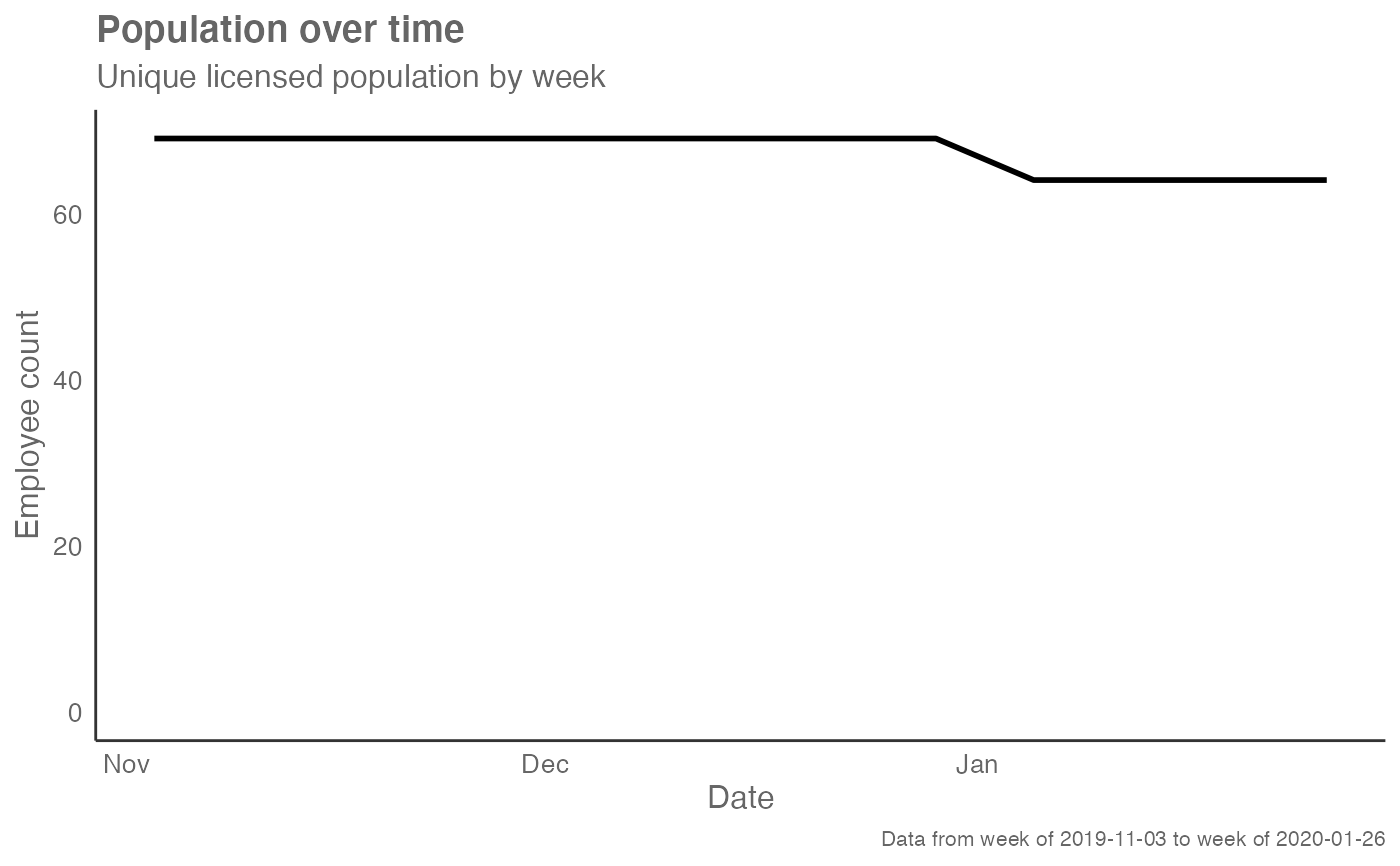
Returns a line chart showing the change in employee count over time. Part of a data validation process to check for unusual license growth / declines over time.
hr_trend(data, return = "plot")Arguments
Value
A different output is returned depending on the value passed to the return
argument:
"plot": ggplot object. A line plot showing employee count over time."table": data frame containing a summary table.
See also
Other Visualization:
afterhours_dist(),
afterhours_fizz(),
afterhours_line(),
afterhours_rank(),
afterhours_summary(),
afterhours_trend(),
collaboration_area(),
collaboration_dist(),
collaboration_fizz(),
collaboration_line(),
collaboration_rank(),
collaboration_sum(),
collaboration_trend(),
create_bar(),
create_bar_asis(),
create_boxplot(),
create_bubble(),
create_dist(),
create_fizz(),
create_inc(),
create_line(),
create_line_asis(),
create_period_scatter(),
create_rank(),
create_sankey(),
create_scatter(),
create_stacked(),
create_tracking(),
create_trend(),
email_dist(),
email_fizz(),
email_line(),
email_rank(),
email_summary(),
email_trend(),
external_dist(),
external_fizz(),
external_line(),
external_network_plot(),
external_rank(),
external_sum(),
hrvar_count(),
hrvar_trend(),
internal_network_plot(),
keymetrics_scan(),
meeting_dist(),
meeting_fizz(),
meeting_line(),
meeting_quality(),
meeting_rank(),
meeting_summary(),
meeting_trend(),
meetingtype_dist(),
meetingtype_dist_ca(),
meetingtype_dist_mt(),
meetingtype_summary(),
mgrcoatt_dist(),
mgrrel_matrix(),
one2one_dist(),
one2one_fizz(),
one2one_freq(),
one2one_line(),
one2one_rank(),
one2one_sum(),
one2one_trend(),
period_change(),
workloads_dist(),
workloads_fizz(),
workloads_line(),
workloads_rank(),
workloads_summary(),
workloads_trend(),
workpatterns_area(),
workpatterns_rank()
Other Data Validation:
check_query(),
extract_hr(),
flag_ch_ratio(),
flag_em_ratio(),
flag_extreme(),
flag_outlooktime(),
hrvar_count(),
hrvar_count_all(),
hrvar_trend(),
identify_churn(),
identify_holidayweeks(),
identify_inactiveweeks(),
identify_nkw(),
identify_outlier(),
identify_privacythreshold(),
identify_query(),
identify_shifts(),
identify_shifts_wp(),
identify_tenure(),
remove_outliers(),
standardise_pq(),
subject_validate(),
subject_validate_report(),
track_HR_change(),
validation_report()
Examples
# Return plot
hr_trend(dv_data)


# Return summary table
hr_trend(dv_data, return = "table")
#> # A tibble: 13 × 2
#>    Date           n
#>    <date>     <int>
#>  1 2019-11-03    69
#>  2 2019-11-10    69
#>  3 2019-11-17    69
#>  4 2019-11-24    69
#>  5 2019-12-01    69
#>  6 2019-12-08    69
#>  7 2019-12-15    69
#>  8 2019-12-22    69
#>  9 2019-12-29    69
#> 10 2020-01-05    64
#> 11 2020-01-12    64
#> 12 2020-01-19    64
#> 13 2020-01-26    64
# Return summary table
hr_trend(dv_data, return = "table")
#> # A tibble: 13 × 2
#> Date n
#> <date> <int>
#> 1 2019-11-03 69
#> 2 2019-11-10 69
#> 3 2019-11-17 69
#> 4 2019-11-24 69
#> 5 2019-12-01 69
#> 6 2019-12-08 69
#> 7 2019-12-15 69
#> 8 2019-12-22 69
#> 9 2019-12-29 69
#> 10 2020-01-05 64
#> 11 2020-01-12 64
#> 12 2020-01-19 64
#> 13 2020-01-26 64