Create an area plot of emails and IMs by hour of the day
Source:R/workpatterns_area.R
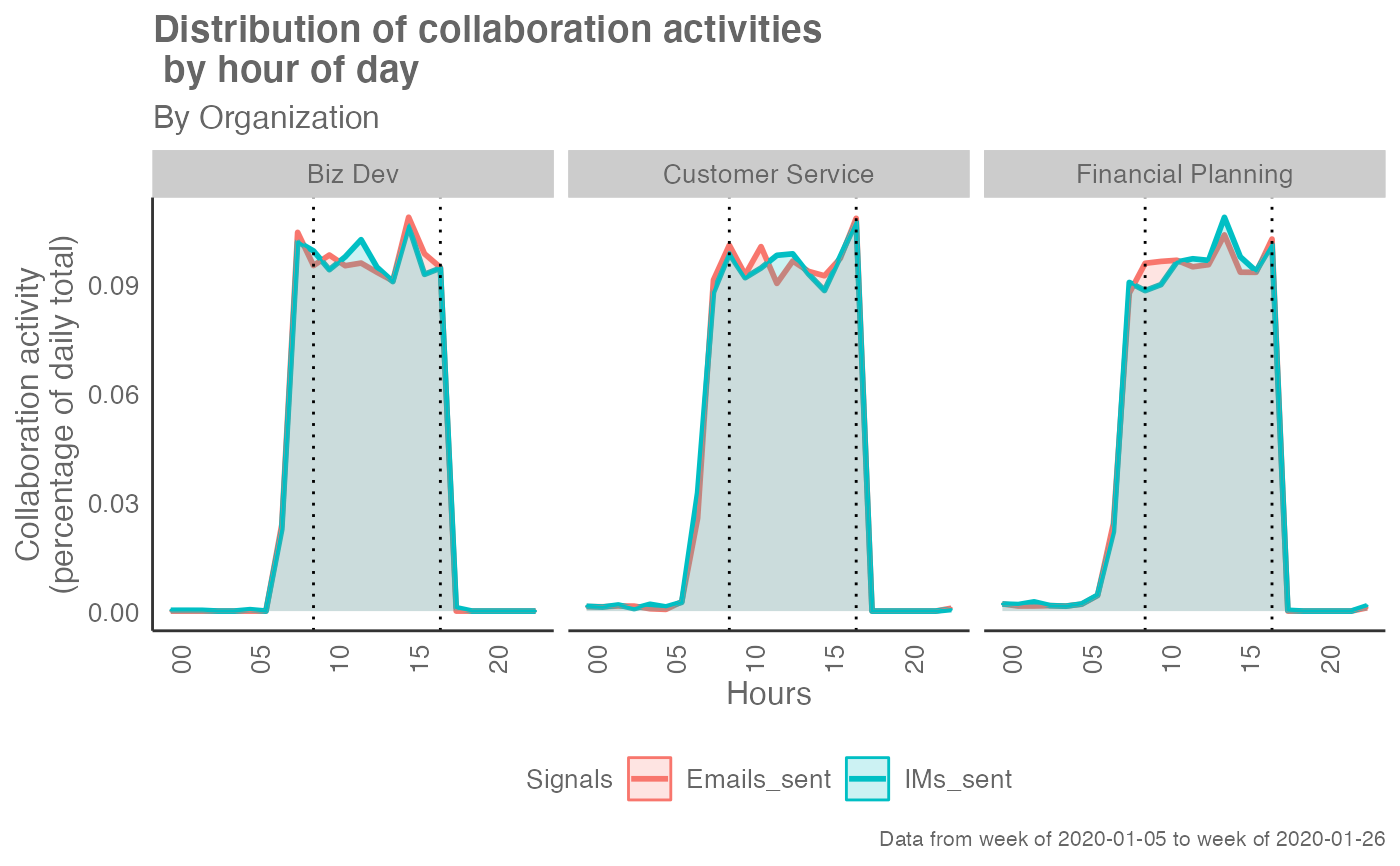
workpatterns_area.RdUses the Hourly Collaboration query to produce an area plot of Emails sent and IMs sent attended by hour of the day.
workpatterns_area(
  data,
  hrvar = "Organization",
  mingroup = 5,
  signals = c("email", "IM"),
  return = "plot",
  values = "percent",
  start_hour = "0900",
  end_hour = "1700"
)
Arguments
- data
A data frame containing data from the Hourly Collaboration query.
- hrvar
HR Variable by which to split metrics. Accepts a character vector, defaults to
"Organization"but accepts any character vector, e.g."LevelDesignation"- mingroup
Numeric value setting the privacy threshold / minimum group size, defaults to 5.
- signals
Character vector to specify which collaboration metrics to use:
a combination of signals, such as
c("email", "IM")(default)"email"for emails only"IM"for Teams messages only"unscheduled_calls"for Unscheduled Calls only"meetings"for Meetings only
- return
String specifying what to return. This must be one of the following strings:
"plot""table"
See
Valuefor more information.- values
Character vector to specify whether to return percentages or absolute values in "data" and "plot". Valid values are:
"percent": percentage of signals divided by total signals (default)"abs": absolute count of signals
- start_hour
A character vector specifying starting hours, e.g. "0900"
- end_hour
A character vector specifying starting hours, e.g. "1700"
Value
A different output is returned depending on the value passed to the return
argument:
"plot": ggplot object. An overlapping area plot (default)."table": data frame. A summary table.
See also
Other Visualization:
afterhours_dist(),
afterhours_fizz(),
afterhours_line(),
afterhours_rank(),
afterhours_summary(),
afterhours_trend(),
collaboration_area(),
collaboration_dist(),
collaboration_fizz(),
collaboration_line(),
collaboration_rank(),
collaboration_sum(),
collaboration_trend(),
create_bar(),
create_bar_asis(),
create_boxplot(),
create_bubble(),
create_dist(),
create_fizz(),
create_inc(),
create_line(),
create_line_asis(),
create_period_scatter(),
create_rank(),
create_sankey(),
create_scatter(),
create_stacked(),
create_tracking(),
create_trend(),
email_dist(),
email_fizz(),
email_line(),
email_rank(),
email_summary(),
email_trend(),
external_dist(),
external_fizz(),
external_line(),
external_network_plot(),
external_rank(),
external_sum(),
hr_trend(),
hrvar_count(),
hrvar_trend(),
internal_network_plot(),
keymetrics_scan(),
meeting_dist(),
meeting_fizz(),
meeting_line(),
meeting_quality(),
meeting_rank(),
meeting_summary(),
meeting_trend(),
meetingtype_dist(),
meetingtype_dist_ca(),
meetingtype_dist_mt(),
meetingtype_summary(),
mgrcoatt_dist(),
mgrrel_matrix(),
one2one_dist(),
one2one_fizz(),
one2one_freq(),
one2one_line(),
one2one_rank(),
one2one_sum(),
one2one_trend(),
period_change(),
workloads_dist(),
workloads_fizz(),
workloads_line(),
workloads_rank(),
workloads_summary(),
workloads_trend(),
workpatterns_rank()
Other Working Patterns:
flex_index(),
identify_shifts(),
identify_shifts_wp(),
plot_flex_index(),
workpatterns_classify(),
workpatterns_classify_bw(),
workpatterns_classify_pav(),
workpatterns_hclust(),
workpatterns_rank(),
workpatterns_report()
Other Working Patterns:
flex_index(),
identify_shifts(),
identify_shifts_wp(),
plot_flex_index(),
workpatterns_classify(),
workpatterns_classify_bw(),
workpatterns_classify_pav(),
workpatterns_hclust(),
workpatterns_rank(),
workpatterns_report()
Examples
# Create a sample small dataset
orgs <- c("Customer Service", "Financial Planning", "Biz Dev")
em_data <- em_data[em_data$Organization %in% orgs, ]
# Return visualization of percentage distribution
workpatterns_area(em_data, return = "plot", values = "percent")
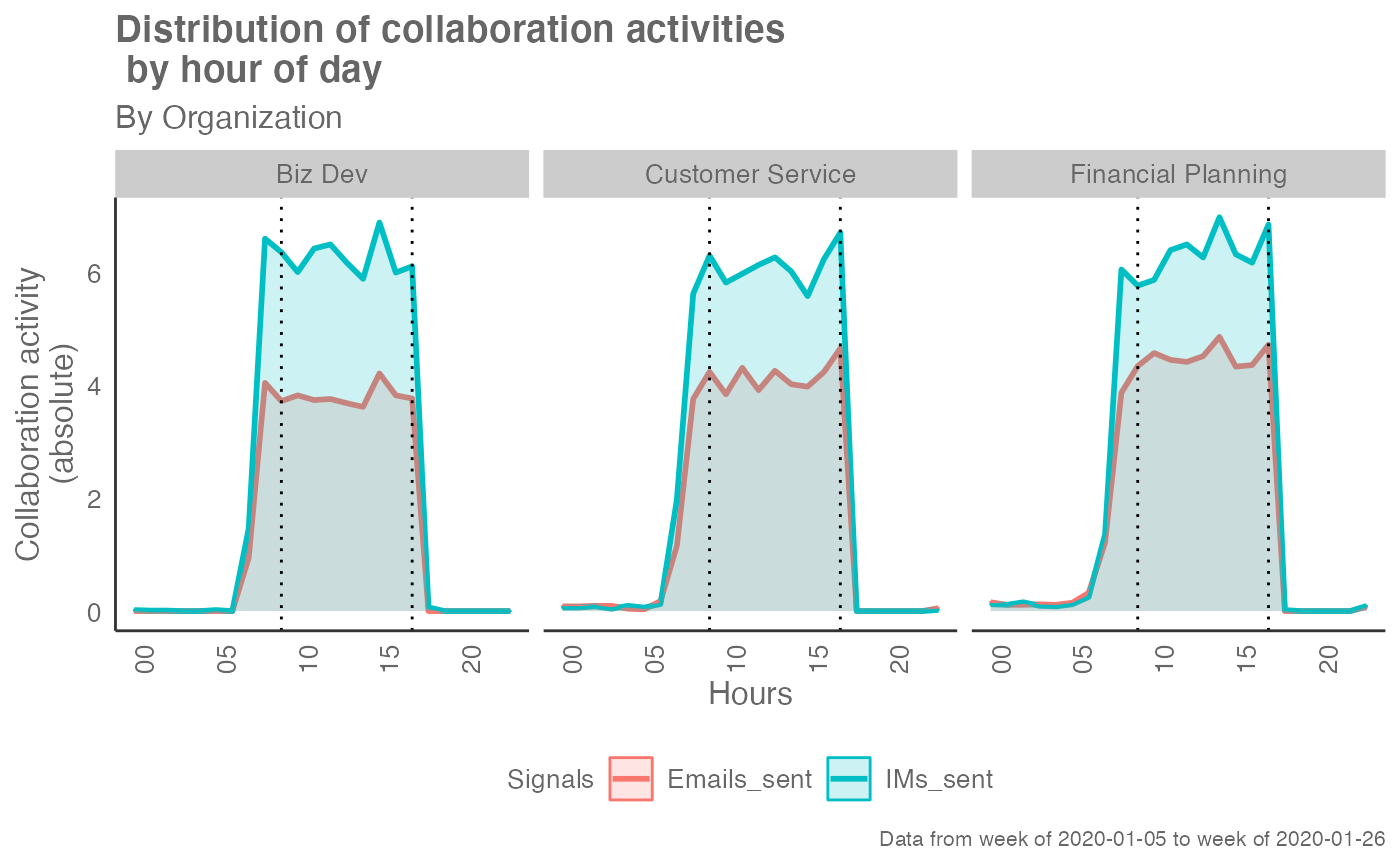
 # Return visualization of absolute values
# \donttest{
workpatterns_area(em_data, return = "plot", values = "abs")
# Return visualization of absolute values
# \donttest{
workpatterns_area(em_data, return = "plot", values = "abs")
 # }
# Return summary table
# \donttest{
workpatterns_area(em_data, return = "table")
#> # A tibble: 72 × 5
#> group Hours Emails_sent IMs_sent n
#> <chr> <dbl> <dbl> <dbl> <int>
#> 1 Biz Dev 0 0 0.000223 27
#> 2 Biz Dev 1 0 0.000227 27
#> 3 Biz Dev 2 0 0.000212 27
#> 4 Biz Dev 3 0 0 27
#> 5 Biz Dev 4 0 0 27
#> 6 Biz Dev 5 0 0.000394 27
#> 7 Biz Dev 6 0 0 27
#> 8 Biz Dev 7 0.0238 0.0226 27
#> 9 Biz Dev 8 0.105 0.102 27
#> 10 Biz Dev 9 0.0953 0.0994 27
#> # ℹ 62 more rows
# }
# }
# Return summary table
# \donttest{
workpatterns_area(em_data, return = "table")
#> # A tibble: 72 × 5
#> group Hours Emails_sent IMs_sent n
#> <chr> <dbl> <dbl> <dbl> <int>
#> 1 Biz Dev 0 0 0.000223 27
#> 2 Biz Dev 1 0 0.000227 27
#> 3 Biz Dev 2 0 0.000212 27
#> 4 Biz Dev 3 0 0 27
#> 5 Biz Dev 4 0 0 27
#> 6 Biz Dev 5 0 0.000394 27
#> 7 Biz Dev 6 0 0 27
#> 8 Biz Dev 7 0.0238 0.0226 27
#> 9 Biz Dev 8 0.105 0.102 27
#> 10 Biz Dev 9 0.0953 0.0994 27
#> # ℹ 62 more rows
# }