Plot a Sample of Working Patterns using Flexibility Index output
Source:R/plot_flex_index.R
plot_flex_index.RdThis is a helper function for plotting visualizations for the
Flexibility Index using the data output from flex_index(). This is used
within flex_index() itself as an internal function.
plot_flex_index(
  data,
  sig_label = "Signals_sent_",
  method = "sample",
  start_hour = 9,
  end_hour = 17,
  mode = "binary"
)
Arguments
- data
Data frame. Direct data output from
flex_index().- sig_label
Character string for identifying signal labels.
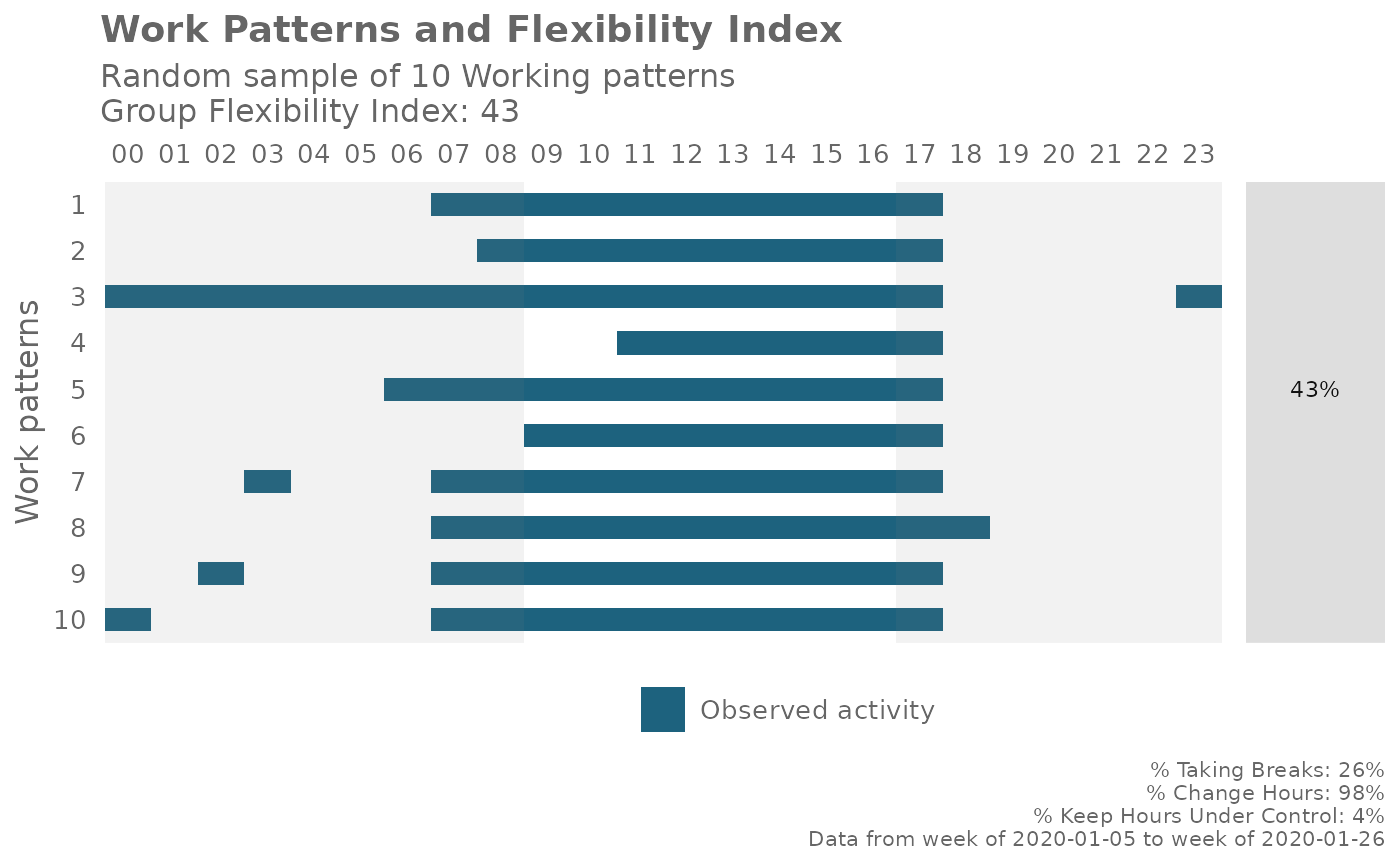
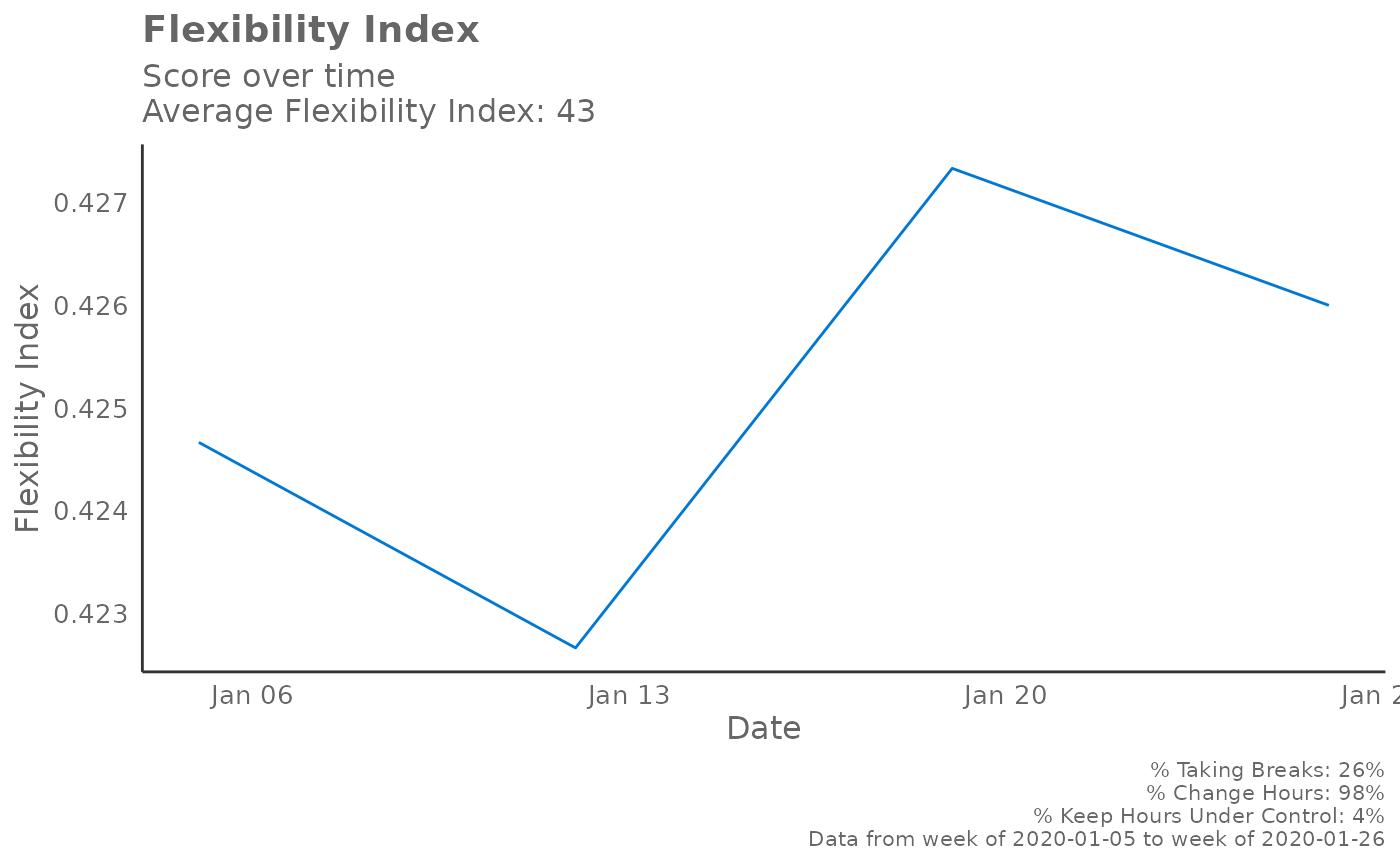
- method
Character string for determining which plot to return. Options include "sample", "common", and "time". "sample" plots a sample of ten working patterns; "common" plots the ten most common working patterns; "time" plots the Flexibility Index for the group over time.
- start_hour
See
flex_index().- end_hour
See
flex_index().- mode
See
flex_index().
Value
ggplot object. See method.
See also
Examples
# \donttest{
# Pre-calculate Flexibility Index
fi_output <- flex_index(em_data, return = "data")
# Examples of how to test the plotting options individually
# Sample of 10 work patterns
plot_flex_index(fi_output, method = "sample")
 # 10 most common work patterns
plot_flex_index(fi_output, method = "common")
# 10 most common work patterns
plot_flex_index(fi_output, method = "common")
 # Plot Flexibility Index over time
plot_flex_index(fi_output, method = "time")
# Plot Flexibility Index over time
plot_flex_index(fi_output, method = "time")
 # }
# }