Identify shifts based on outlook time settings for work day start and end time
Source:R/identify_shifts.R
identify_shifts.RdThis function uses outlook calendar settings for start and end time of work
day to identify work shifts. The relevant variables are
WorkingStartTimeSetInOutlook and WorkingEndTimeSetInOutlook.
identify_shifts(data, return = "plot")Arguments
Value
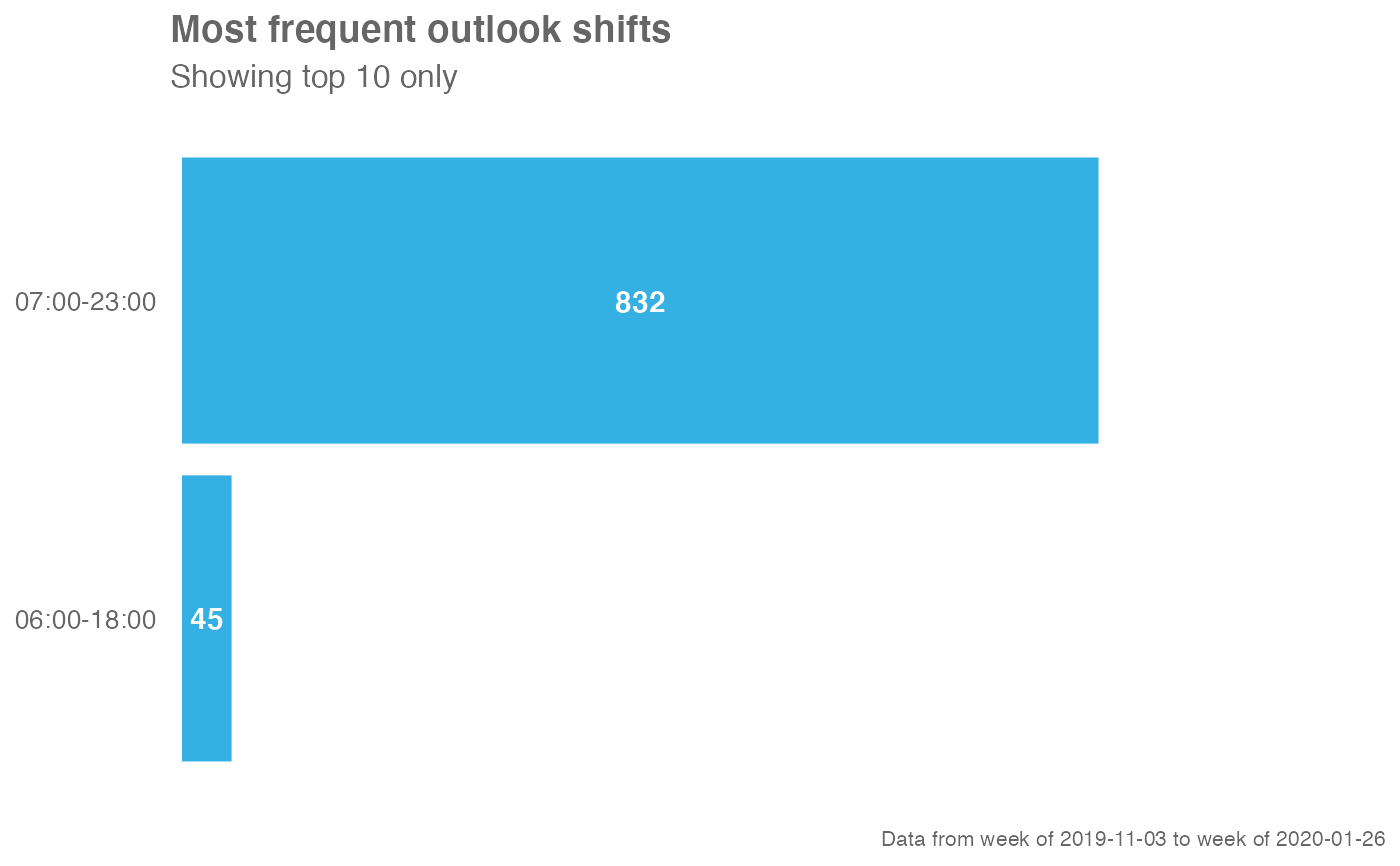
A different output is returned depending on the value passed to the return
argument:
"plot": ggplot object. A bar plot for the weekly count of shifts."table": data frame. A summary table for the count of shifts."data: data frame. Input data appended with theShiftscolumns.
See also
Other Data Validation:
check_query(),
extract_hr(),
flag_ch_ratio(),
flag_em_ratio(),
flag_extreme(),
flag_outlooktime(),
hr_trend(),
hrvar_count(),
hrvar_count_all(),
hrvar_trend(),
identify_churn(),
identify_holidayweeks(),
identify_inactiveweeks(),
identify_nkw(),
identify_outlier(),
identify_privacythreshold(),
identify_query(),
identify_shifts_wp(),
identify_tenure(),
remove_outliers(),
standardise_pq(),
subject_validate(),
subject_validate_report(),
track_HR_change(),
validation_report()
Other Working Patterns:
flex_index(),
identify_shifts_wp(),
plot_flex_index(),
workpatterns_area(),
workpatterns_classify(),
workpatterns_classify_bw(),
workpatterns_classify_pav(),
workpatterns_hclust(),
workpatterns_rank(),
workpatterns_report()
