This page was generated from
docs/examples/DataSet/Datasaver_Builder.ipynb.
Interactive online version:
.
Using datasaver_builder and dond_into to streamline measurements
This example notebook shows examples of how to use the datasaver_builder and dond_into extensions together. It showcases these as an intermediate abstraction layer between the low-level Measurement object and the high-level doNd routines.
Setup
Here, we call necessary imports for running this notebook, as well as setting up a database, dummy parameters, and creating an experiment object.
Main Module Imports
These are the main components we’ll be looking at in this notebook.
[1]:
from qcodes.dataset import DataSetDefinition, LinSweeper, datasaver_builder, dond_into
Other imports
[2]:
from itertools import product
from pathlib import Path

import numpy as np

from qcodes.dataset import (
    LinSweep,
    Measurement,
    initialise_or_create_database_at,
    load_or_create_experiment,
    plot_dataset,
)
from qcodes.parameters import Parameter, ParameterWithSetpoints
from qcodes.validators import Arrays
Set up database and experiment
[3]:
db_path = Path.cwd().parent / "example_output" / "measurement_extensions.db"
initialise_or_create_database_at(db_file_with_abs_path=db_path)
experiment = load_or_create_experiment("Examples")
Dummy Parameter Creation
[4]:
set1 = Parameter("set1", get_cmd=None, set_cmd=None, initial_value=0)
set2 = Parameter("set2", get_cmd=None, set_cmd=None, initial_value=0)
set3 = Parameter("set3", get_cmd=None, set_cmd=None, initial_value=0)


def get_set1():
    return set1()


def get_sum12():
    return set1() + set2()


def get_diff13():
    return set1() - set3()


meas1 = Parameter("meas1", get_cmd=get_set1, set_cmd=False)
meas2 = Parameter("meas2", get_cmd=get_sum12, set_cmd=False)
meas3 = Parameter("meas3", get_cmd=get_diff13, set_cmd=False)
ParameterWithSetpoints Creation
[5]:
def get_setpoints_array():
    return np.linspace(-5, 5, 11)


def get_pws_results():
    setpoints_arr = get_setpoints_array()
    return setpoints_arr**2 * set1()


setpoint_array = Parameter(
    "setpoints", get_cmd=get_setpoints_array, vals=Arrays(shape=(11,))
)

pws = ParameterWithSetpoints(
    "pws",
    setpoints=(setpoint_array,),
    get_cmd=get_pws_results,
    vals=Arrays(shape=(11,)),
)
Using the datasaver_builder
The datasaver_builder is a shortcut to creating multiple qcodes Measurement objects, registering the relevant parameters and dependencies, and entering the datasaver context managers.
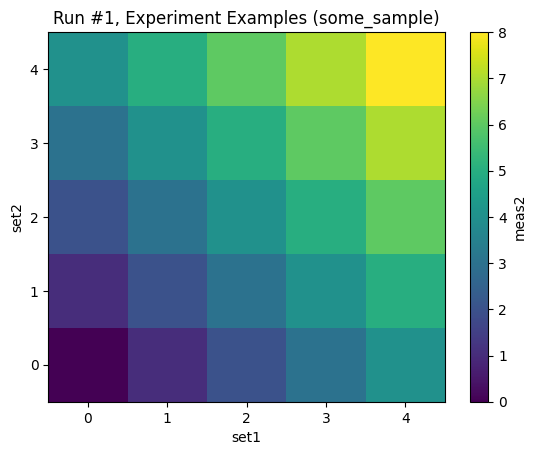
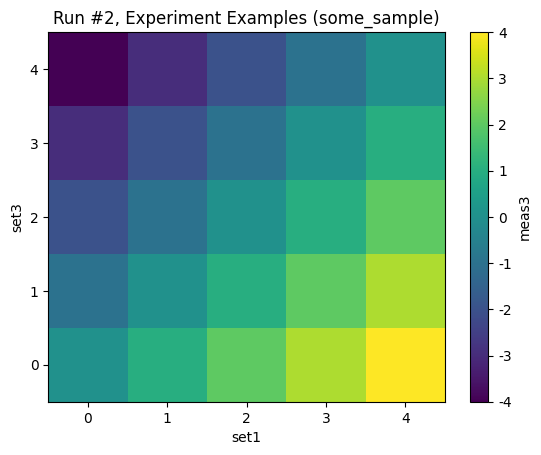
This process begins with the DataSetDefinition, a dataclass specifying the name of the dataset, the independent parameters, the dependent parameters, and optionally the experiment to write the dataset to. If the experiment kwarg is omitted, Qcodes will write to the default experiment. Note that the datasaver_builder assumes that all dependent parameters depend on all independent parameters. This is less flexible than the raw Measurement object, but covers the most common measurement
types.
Once the datasets have been defined, we enter the datasaver_builder by passing the list or tuple of DataSetDefinition objects.
When we enter the context manager, we get a list of the respective datasavers, in an order which matches the order passed. These can be accessed like any other DataSaver, and arbitrary code can be executed in whatever order is needed. When the measurement is complete, these datasavers can then be assigned to datasets which can be plotted.
[6]:
dataset_definition = [
    DataSetDefinition(
        name="dataset_1",
        independent=[set1, set2],
        dependent=[meas2],
        experiment=experiment,
    ),
    DataSetDefinition(
        name="dataset_2",
        independent=[set1, set3],
        dependent=[meas3],
        experiment=experiment,
    ),
]
with datasaver_builder(dataset_definition) as datasavers:
    for val1, val2, val3 in product(range(5), repeat=3):
        set1(val1)
        set2(val2)
        set3(val3)
        meas2_val = meas2()
        meas3_val = meas3()
        datasavers[0].add_result((set1, val1), (set2, val2), (meas2, meas2_val))
        datasavers[1].add_result((set1, val1), (set3, val3), (meas3, meas3_val))
    datasets = [datasaver.dataset for datasaver in datasavers]

plot_dataset(datasets[0])
plot_dataset(datasets[1])
Starting experimental run with id: 1.
Starting experimental run with id: 2.
[6]:
([<Axes: title={'center': 'Run #2, Experiment Examples (some_sample)'}, xlabel='set1', ylabel='set3'>],
 [<matplotlib.colorbar.Colorbar at 0x7fad58802e50>])
Using dond_into
dond_into is a dond-like utility function which performs gridded measurements and writes them to a specified datasaver. Unlike dond however, dond_into can write to the same datasaver – and thus the same dataset – multiple times. There are caveats, though.
dond_intowill not stop a user from measuring the same data point more than once, which may lead to unexpected output shapes, especially when converted to an xarray.dond_intodoes not supportTogetherSweepsor multiple datasets via grouping parameters. These arguments will raise Exceptions if passed.
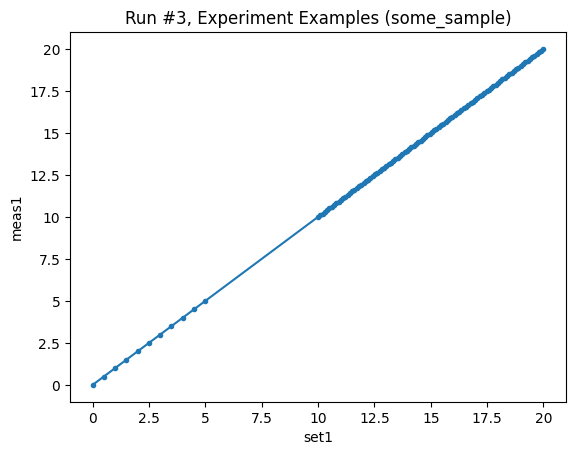
In this example, we take two slices from the same measurement function: one at low resolution, and another at high resolution. Both sets of data are then written to the same dataset.
[7]:
core_test_measurement = Measurement(name="core_test_1", exp=experiment)
core_test_measurement.register_parameter(set1)
core_test_measurement.register_parameter(meas1, setpoints=[set1])
with core_test_measurement.run() as datasaver:
    sweep1 = LinSweep(set1, 0, 5, 11, 0.001)
    dond_into(datasaver, sweep1, meas1)

    sweep2 = LinSweep(set1, 10, 20, 100, 0.001)
    dond_into(datasaver, sweep2, meas1)

    dataset = datasaver.dataset
plot_dataset(dataset, marker=".")
Starting experimental run with id: 3.
[7]:
([<Axes: title={'center': 'Run #3, Experiment Examples (some_sample)'}, xlabel='set1', ylabel='meas1'>],
 [None])
Using datasaver_builder with dond_into and LinSweeper
Put together, the datasaver_builder and dond_into extensions provide a clean way of writing flexible measurement code that too complicated for dond yet too simple for the full power of the Measurement object.
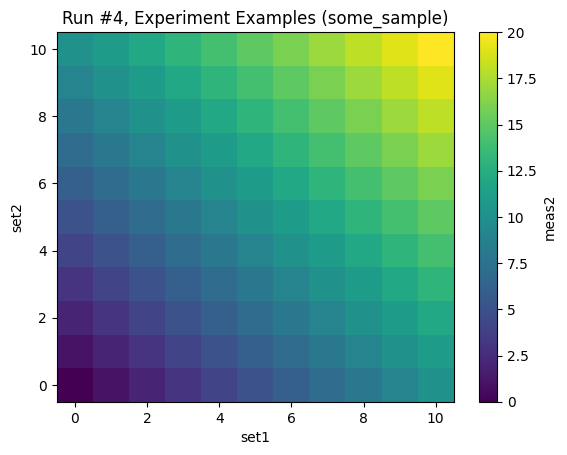
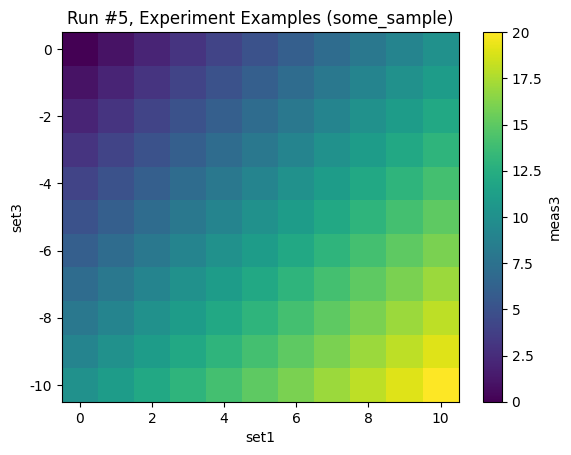
In the example below, we also introduce a new class, the LinSweeper. This is an iterable that sets the given swept parameter according to the inputs. It is useful for building outer-loops, within which more detailed measurements or functions are called. Once again, arbitrary code blocks can be included, simplifying the equivalent of dond’s enter_actions, exit_actions, and break_conditions kwargs. Instead of being arguments, they can be explicitly included in the measurement, and
can be nested precisely where the user wants them.
[8]:
dataset_definition = [
    DataSetDefinition(name="dataset_1", independent=[set1, set2], dependent=[meas2]),
    DataSetDefinition(name="dataset_2", independent=[set1, set3], dependent=[meas3]),
]
with datasaver_builder(dataset_definition) as datasavers:
    for _ in LinSweeper(set1, 0, 10, 11, 0.001):
        sweep1 = LinSweep(set2, 0, 10, 11, 0.001)
        sweep2 = LinSweep(set3, -10, 0, 11, 0.001)
        dond_into(datasavers[0], sweep1, meas2, additional_setpoints=(set1,))
        dond_into(datasavers[1], sweep2, meas3, additional_setpoints=(set1,))
    datasets = [datasaver.dataset for datasaver in datasavers]

plot_dataset(datasets[0])
plot_dataset(datasets[1])
Starting experimental run with id: 4.
Starting experimental run with id: 5.
[8]:
([<Axes: title={'center': 'Run #5, Experiment Examples (some_sample)'}, xlabel='set1', ylabel='set3'>],
 [<matplotlib.colorbar.Colorbar at 0x7fad58660490>])
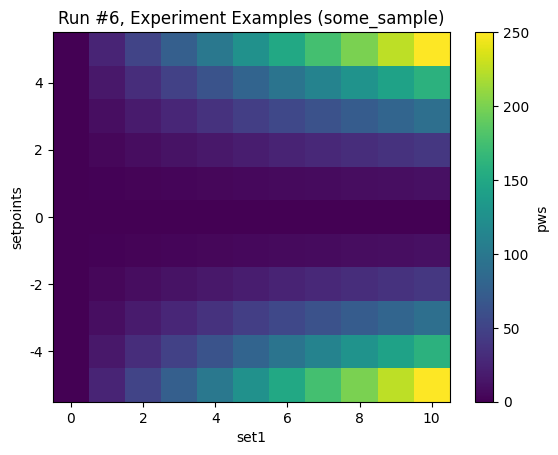
Using datasaver_builder and dond_into with ParameterWithSetpoints
One final use case includes support for the ParameterWithSetpoints. As seen below, the datasaver_builder and dond_into behave intuitively with these special parameters.
[9]:
dataset_definition = [
    DataSetDefinition(name="dataset_1", independent=[set1], dependent=[pws])
]
with datasaver_builder(dataset_definition) as datasavers:
    for _ in LinSweeper(set1, 0, 10, 11, 0.001):
        dond_into(datasavers[0], pws, additional_setpoints=(set1,))

    datasets = [datasaver.dataset for datasaver in datasavers]

plot_dataset(datasets[0])
Starting experimental run with id: 6.
[9]:
([<Axes: title={'center': 'Run #6, Experiment Examples (some_sample)'}, xlabel='set1', ylabel='setpoints'>],
 [<matplotlib.colorbar.Colorbar at 0x7fad58536cd0>])
