Visualize traces#
Experimental feature
This is an experimental feature, and may change at any time. Learn more.
Prompt flow provides several trace toolkits in promptflow-devkit. This page will introduce trace UI, where user can better capture and visualize the internal execution details for flows. With trace UI, user can track and visualize flow execution, which provides critical insights for developer to understand the internal details of execution.
Overview#
With promptflow-devkit installed, running python script with start_trace will produce below example output:
Prompt flow service has started...
You can view the traces from local: http://127.0.0.1:<port>/v1.0/ui/traces/?#collection=basic
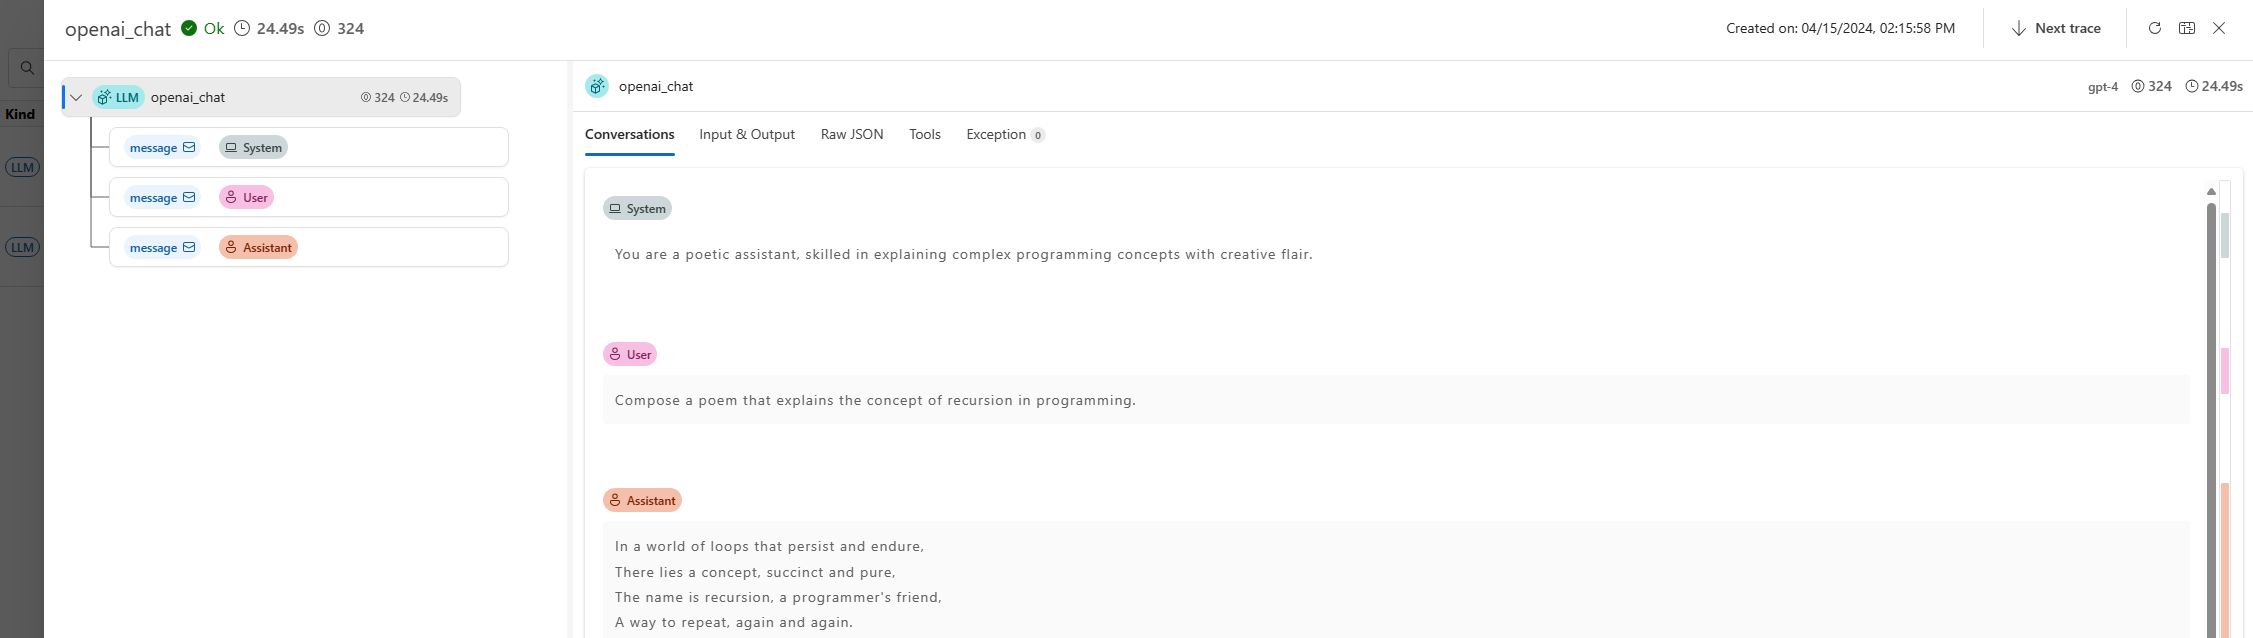
Click the url, user will see a trace list that corresponding to each LLM calls:

Click on one line record, the LLM detail will be displayed with chat window experience, together with other LLM call params:
When combine trace and flow, trace UI provides a more comprehensive view of the flow execution, user can easily track the flow execution details, and debug the flow execution issues.
Flow test#
If your application is created with DAG flow, all flow test and batch run will be automatically enable trace function. Take the chat_with_pdf as example.
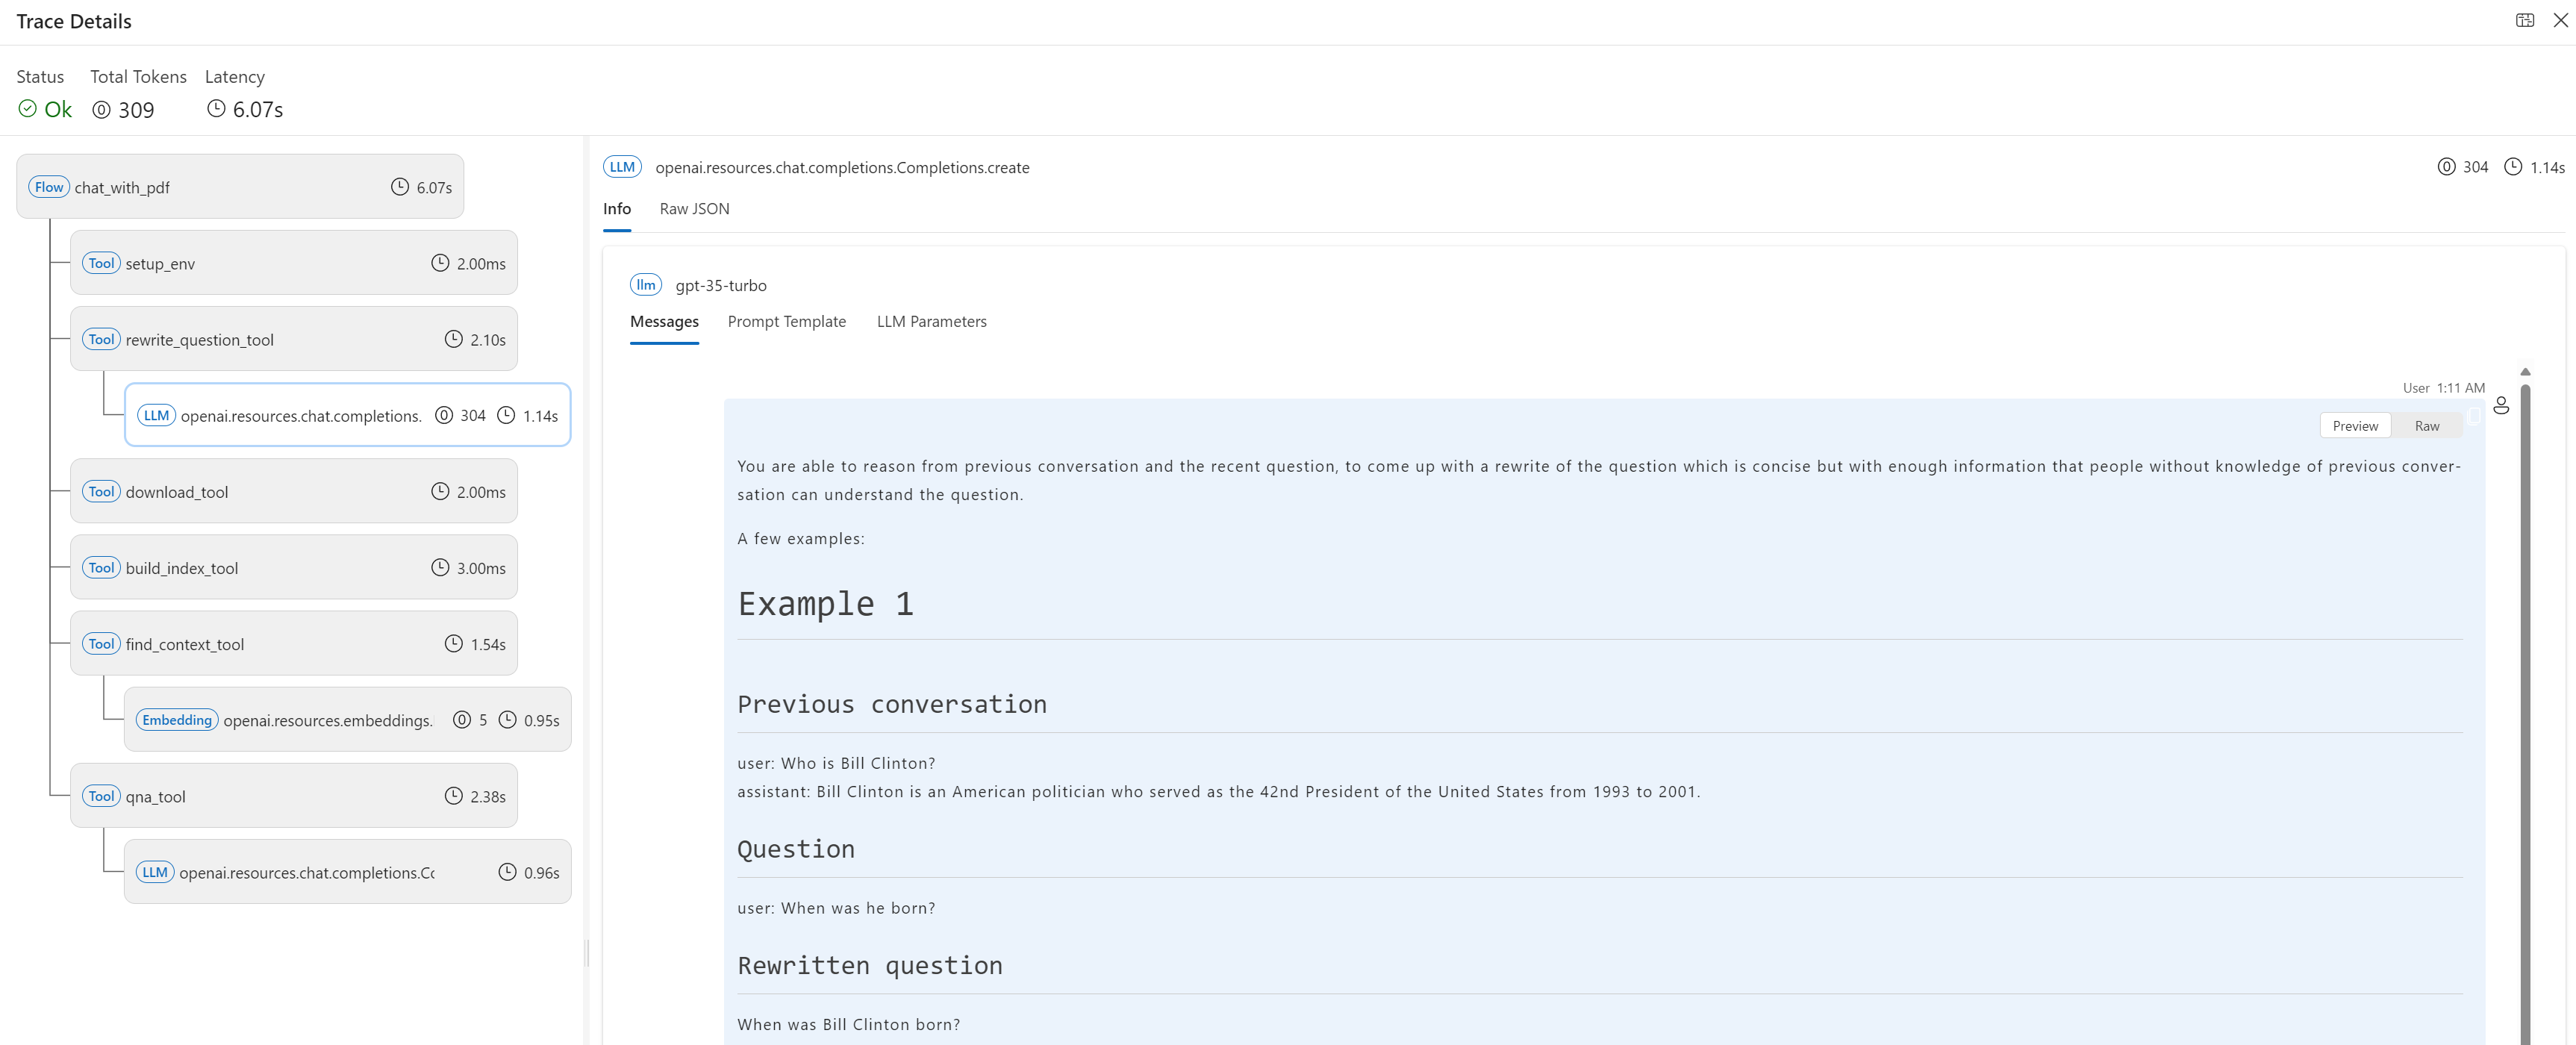
Run pf flow test --flow ., each flow test will generate single line in the trace UI:
Click a record, the trace details will be visualized as tree view.
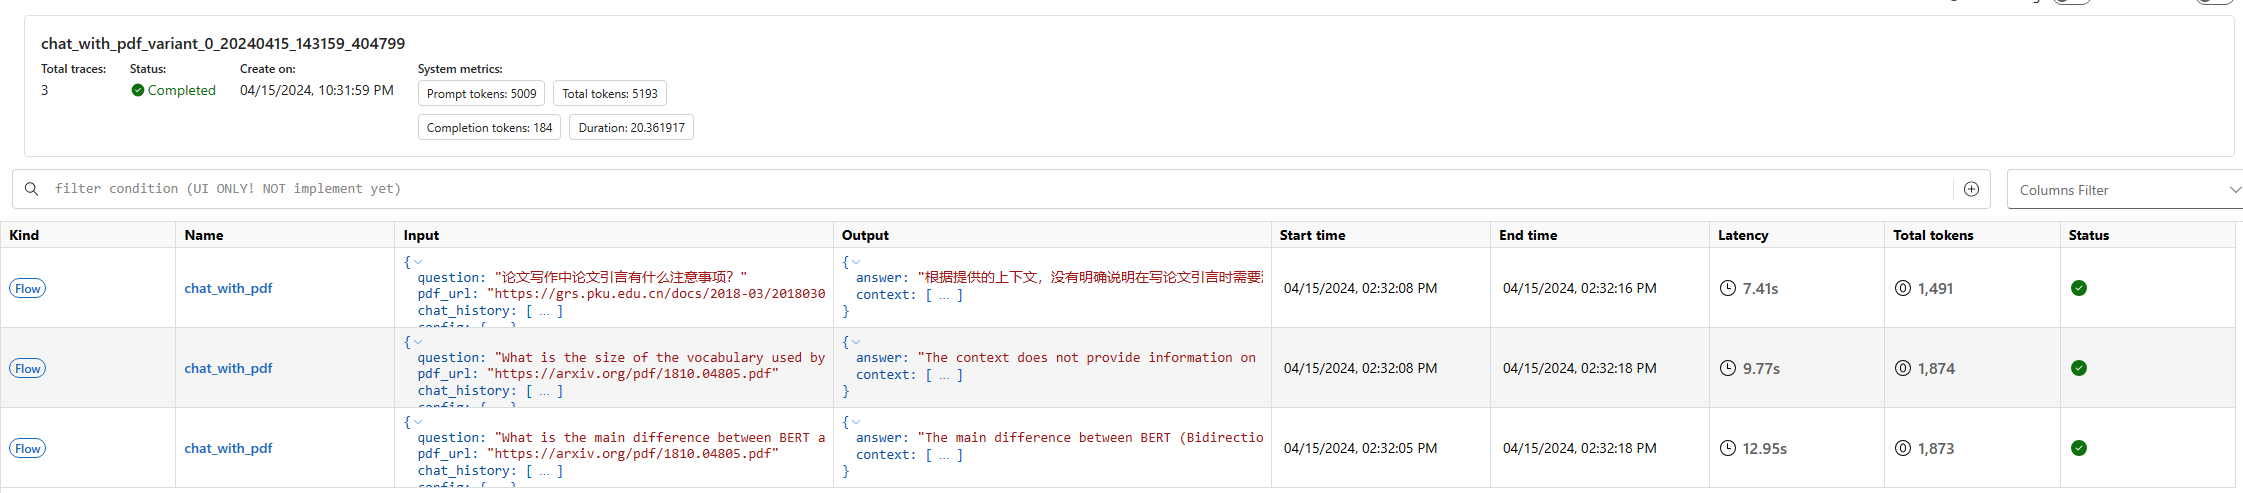
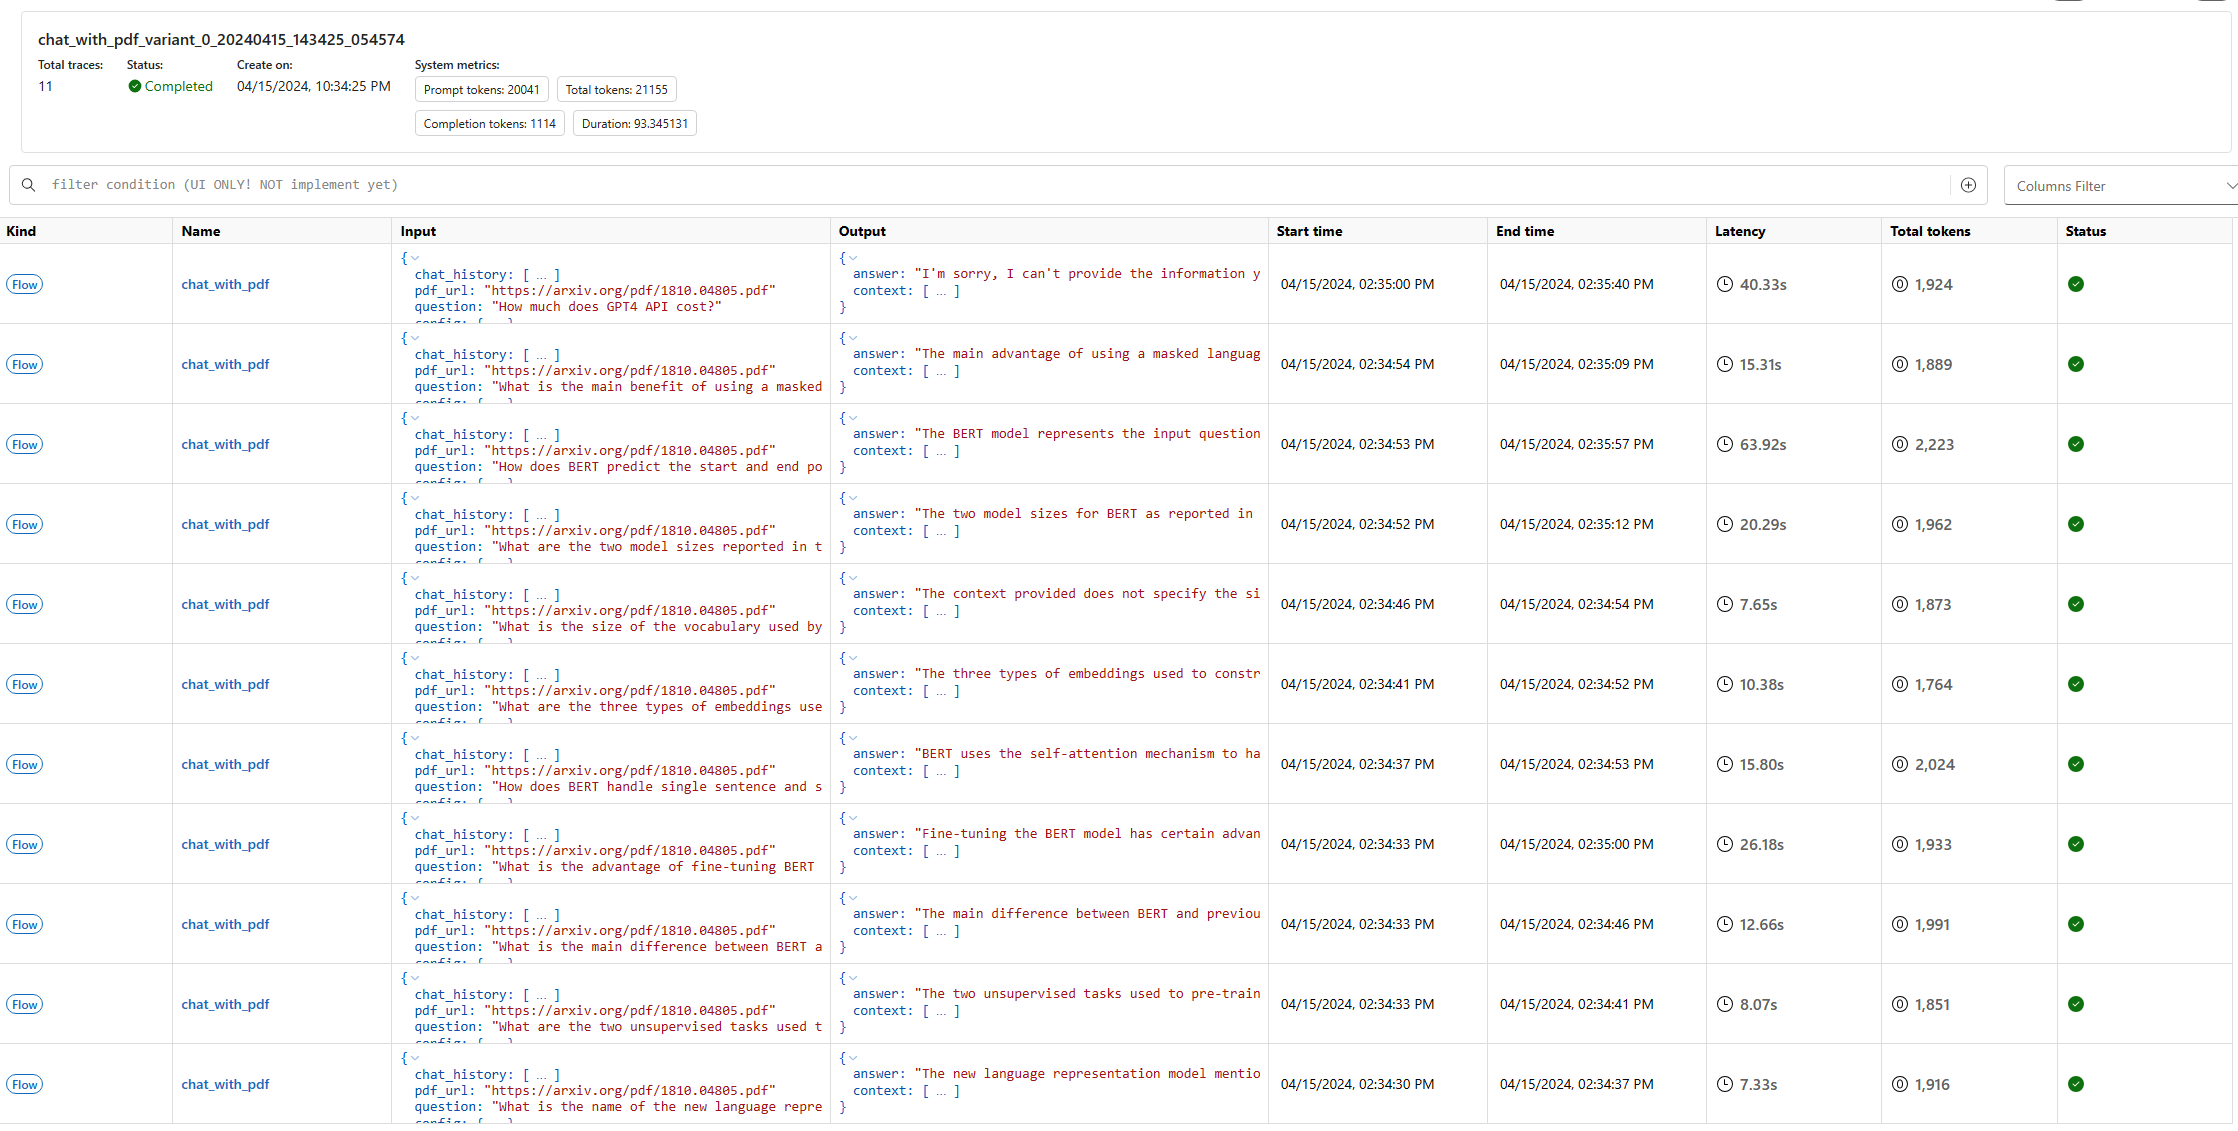
Evaluate against batch data#
Keep using chat_with_pdf as example, to trigger a batch run, you can use below command under the folder (you can learn more from Run and evaluate a flow to understand what does below command do):
pf run create --flow . --data "./data/bert-paper-qna.jsonl" --column-mapping chat_history='${data.chat_history}' pdf_url='${data.pdf_url}' question='${data.question}'
Then you will get a run related trace URL, e.g. http://127.0.0.1:<port>/v1.0/ui/traces?run=chat_with_pdf_20240226_181222_219335
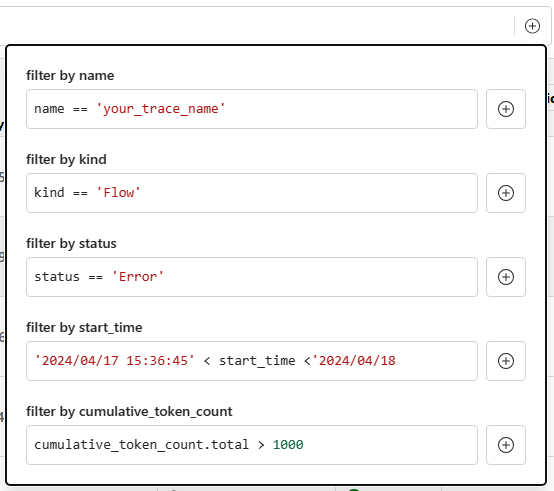
Search#
Trace UI supports simple Python expression for search experience, which is demonstrated in below GIF:
Currently it supports:
Operators:
bool:
andandorcompare:
==,!=,>,>=,<and<=
Searchable fields:
metadata:
name,kindandstatustime:
start_timetoken count:
cumulative_token_count.total,cumulative_token_count.promptandcumulative_token_count.completion
You can also find the hints by clicking the button right to the search edit box: