DataViewMappings
The article is outdated, read updated article about data view mappings in official documentation of Power BI.
A dataViewMappings describes how the data roles relate to each other and allows you to specify conditional requirements for the them.
There is a section for each of the dataMappings.
Each valid mapping will produce a DataView, but currently we only support performing one query per visual so in most situations you will only get one DataView. However, you can provide multiple data mappings with different conditions which allow
"dataViewMappings": [
    {
        "conditions": [ ... ],
        "categorical": { ... },
        "single": { ... },
        "table": { ... },
        "matrix": { ... }
    }
]
Important to note that Power BI creates a mapping to a DataView if and only if the valid mapping is filled in dataViewMappings.
In other words if categorical is defined in dataViewMappings but other mappings such as table, single, etc. are not, as in the following example:
"dataViewMappings": [
    {
        "categorical": { ... }
    }
]
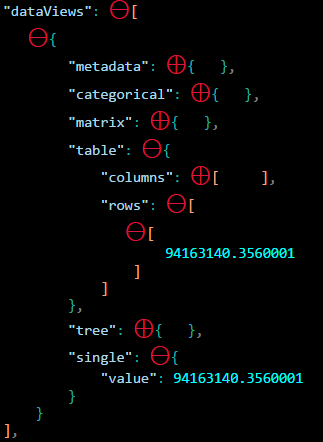
Power BI will produce a DataView with a single categorical mapping (table and other mappings will be undefined):
{
    "categorical": {
        "categories": [ ... ],
        "values": [ ... ]
    },
    "metadata": { ... }
}
Conditions
Describes conditions for a particular data mapping. You can provide multiple sets of conditions and if the data matches one of the described sets of conditions the visual will accept the data as valid.
Currently, for each field you can specify a min and max value. This represents the number of fields that can be bound to that data role.
Note: if a data role is omitted in the condition, it can have any number of fields.
Example 1
By default, you can drag multiple fields into each data role. In this example we limit category to 1 data field and measure to 2 data fields.
"conditions": [
    { "category": { "max": 1 }, "y": { "max": 2 } },
]
Example 2
In this example, one of two conditions are required. Either exactly 1 category data field and exactly 2 measures, or exactly 2 categories and exactly one measure.
"conditions": [
    { "category": { "min": 1, "max": 1 }, "measure": { "min": 2, "max": 2 } },
    { "category": { "min": 2, "max": 2 }, "measure": { "min": 1, "max": 1 } }
]
Single Data Mapping
Single data mapping is the simplest form of data mapping. It accepts a single measure field and gives you the total. If the field is numeric it will give you the sum. Otherwise it will give you a count of unique values.
To use single data mapping you simply define the name of the data role you want to map. This will only work with a single measure field. If a second field is assigned no data view will be generated so it is also good practice to include a condition that limits the data to a single field.
Note: This data mapping cannot be used in conjunction with any other data mapping. It is meant to reduce data into a single numeric value.
Example
"dataViewMappings": {
    "conditions": [
        { "Y": { "max": 1 } }
    ],
    "single": {
        "role": "Y"
    }
}
The resulting data view will still contain the other types (table, categorical, etc), but each mapping will only contain the single value. Best practice is to just access the value inside of single.
Categorical Data Mapping
Categorical data mapping is used to get one or two independent grouping of data.
Example 1 Here is the definition from our previous example on DataRoles.
"dataRole":[
    {
        "displayName": "Category",
        "name": "category",
        "kind": 0
    },
    {
        "displayName": "Y Axis",
        "name": "measure",
        "kind": 1
    }
]
Now for the mapping:
"dataViewMappings": {
    "categorical": {
        "categories": {
            "for": { "in": "category" }
        },
        "values": {
            "select": [
                { "bind": { "to": "measure" } }
            ]
        }
    }
}
This is a very simple example, in plain english it reads “Map my category DataRole so that for every field I drag into category, its data is mapped to categorical.categories. Also map my measure DataRole to categorical.values.”
- for…in - For all the items in this data role, include them in the data query.
- bind…to - Produces the same result as for…in, but expects that the DataRole will have a condition restricting it to a single field.
Example2
In this example, we will use the first two DataRoles from the previous example, additionally defining grouping and measure2.
"dataRole":[
    {
        "displayName": "Category",
        "name": "category",
        "kind": 0
    },
    {
        "displayName": "Y Axis",
        "name": "measure",
        "kind": 1
    },
    {
        "displayName": "Grouping with",
        "name": "grouping",
        "kind": 0
    },
    {
        "displayName": "X Axis",
        "name": "measure2",
        "kind": 1
    }
]
Now for the mapping:
"dataViewMappings":{
    "categorical": {
        "categories": {
            "for": { "in": "category" }
        },
        "values": {
            "group": {
                "by": "grouping",
                "select":[
                    { "bind": { "to": "measure" } },
                    { "bind": { "to": "measure2" } }
                ]
            }
        }
    }
}
Here the difference is in how we are mapping categorical.values. We are saying “Map my measure and measure2 DataRoles to be grouped by the DataRole grouping.”
Example3 Here are the dataRoles.
"dataRoles": [
    {
        "displayName": "Categories",
        "name": "category",
        "kind": 0
    },
    {
        "displayName": "Measures",
        "name": "measure",
        "kind": 1
    },
    {
        "displayName": "Series",
        "name": "series",
        "kind": 0
    }
]
Here are the dataViewMappings.
"dataViewMappings": [
    {
        "categorical": {
            "categories": {
                "for": {
                    "in": "category"
                }
            },
            "values": {
                "group": {
                    "by": "series",
                    "select": [{
                            "for": {
                                "in": "measure"
                            }
                        }
                    ]
                }
            }
        }
    }
]
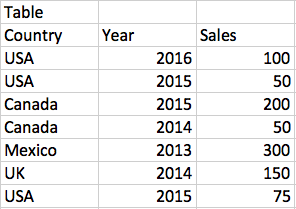
The categorical dataview could be visualized like this.
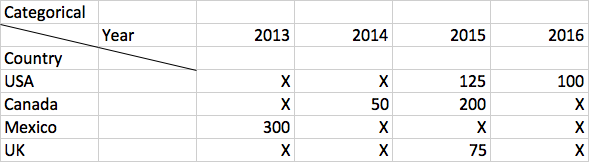
PowerBI will produce you this as the categorical dataview. This is the set of categories.
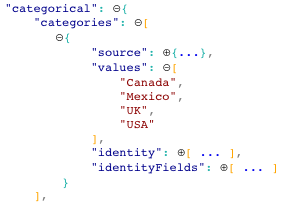
Each category maps to a set of values as well. Each of these values is grouped by series, which is years.
For example, Canada sales in 2013 is null, Canada sales in 2014 is 50.
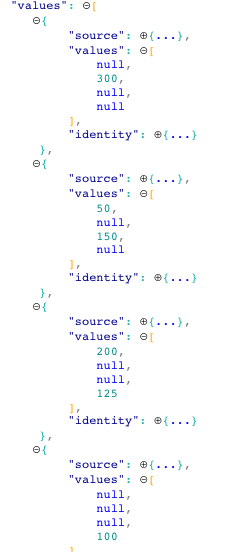
Table Data Mapping
The table data view is a simple data mapping. Essentially, it is a list of data points, where numeric data points could be aggregated.
Example1
With the given capabilities:
"dataRoles": [
    {
        "displayName": "Values",
        "name": "values",
        "kind": 2
    }
]
"dataViewMappings": [
    {
        "table": {
            "rows": {`
                "for": {
                    "in": "values"
                }
            }
        }
    }
]
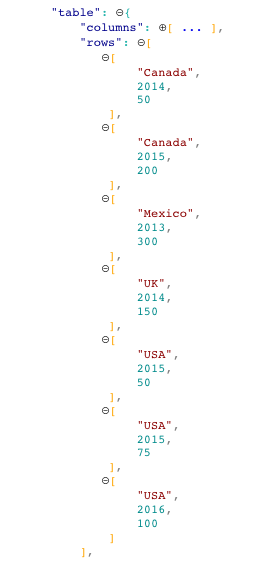
The table dataview could be visualized like this.
PowerBI will produce you this as the table dataview. Do not assume there is an ordering.
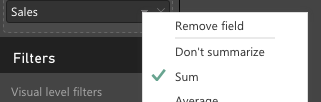
The data can be aggregated by selecting the desired field and clicking sum.
Matrix Data Mapping
Matrix Data Mapping is similar to table data mapping, but rows are presented hierarchically. And one of dataRole values can be used as a column header value.
{
    "dataRoles": [
        {
            "name": "Category",
            "displayName": "Category",
            "displayNameKey": "Visual_Category",
            "kind": "Grouping"
        },
        {
            "name": "Column",
            "displayName": "Column",
            "displayNameKey": "Visual_Column",
            "kind": "Grouping"
        },
        {
            "name": "Measure",
            "displayName": "Measure",
            "displayNameKey": "Visual_Values",
            "kind": "Measure"
        }
    ],
    "dataViewMappings": [
        {
            "matrix": {
                "rows": {
                    "for": {
                        "in": "Category"
                    }
                },
                "columns": {
                    "for": {
                        "in": "Column"
                    }
                },
                "values": {
                    "select": [
                        {
                            "for": {
                                "in": "Measure"
                            }
                        }
                    ]
                }
            }
        }
    ]
}
Power BI creates hierarchical data stucture. The root of tree includes the data from the first column of Category data role with children from the second column of data role.
Sample dataset:
| Parents | Children | Grand children | Columns | Values |
|---|---|---|---|---|
| Parent1 | Child1 | Grand child1 | Col1 | 5 |
| Parent1 | Child1 | Grand child1 | Col2 | 6 |
| Parent1 | Child1 | Grand child2 | Col1 | 7 |
| Parent1 | Child1 | Grand child2 | Col2 | 8 |
| Parent1 | Child2 | Grand child3 | Col1 | 5 |
| Parent1 | Child2 | Grand child3 | Col2 | 3 |
| Parent1 | Child2 | Grand child4 | Col1 | 4 |
| Parent1 | Child2 | Grand child4 | Col2 | 9 |
| Parent1 | Child2 | Grand child5 | Col1 | 3 |
| Parent1 | Child2 | Grand child5 | Col2 | 5 |
| Parent2 | Child3 | Grand child6 | Col1 | 1 |
| Parent2 | Child3 | Grand child6 | Col2 | 2 |
| Parent2 | Child3 | Grand child7 | Col1 | 7 |
| Parent2 | Child3 | Grand child7 | Col2 | 1 |
| Parent2 | Child3 | Grand child8 | Col1 | 10 |
| Parent2 | Child3 | Grand child8 | Col2 | 13 |
Core Matrix visual of Power BI renders it like a table.
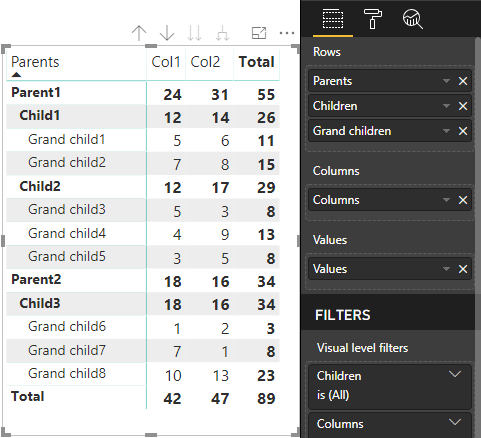
The visual gets data stucture as described below (only the first two rows are presented):
{
    "metadata": {...},
    "matrix": {
        "rows": {
            "levels": [...],
            "root": {
                "childIdentityFields": [...],
                "children": [
                    {
                        "level": 0,
                        "levelValues": [...],
                        "value": "Parent1",
                        "identity": {...},
                        "childIdentityFields": [...],
                        "children": [
                            {
                                "level": 1,
                                "levelValues": [...],
                                "value": "Child1",
                                "identity": {...},
                                "childIdentityFields": [...],
                                "children": [
                                    {
                                        "level": 2,
                                        "levelValues": [...],
                                        "value": "Grand child1",
                                        "identity": {...},
                                        "values": {
                                            "0": {
                                                "value": 5 // value for Col1
                                            },
                                            "1": {
                                                "value": 6 // value for Col2
                                            }
                                        }
                                    },
                                    ...
                                ]
                            },
                            ...
                        ]
                    },
                    ...
                ]
            }
        },
        "columns": {
            "levels": [...],
            "root": {
                "childIdentityFields": [...],
                "children": [
                    {
                        "level": 0,
                        "levelValues": [...],
                        "value": "Col1",
                        "identity": {...}
                    },
                    {
                        "level": 0,
                        "levelValues": [...],
                        "value": "Col2",
                        "identity": {...}
                    },
                    ...
                ]
            }
        },
        "valueSources": [...]
    }
}
Data Reduction Algorithm
A DataReductionAlgorithm can be applied if you want to control the amount of data received in the DataView.
By default all Custom Visuals have the top DataReductionAlgorithm applied with the “count” set to 1000 dataPoints. This is equivalent to setting the following properties in the capabilities.json:
"dataReductionAlgorithm": {
    "top": {
        "count": 1000
    }
}
You can modify the ‘count’ value to any integer value up to 30000. R-based custom visuals can support up to 150000 rows.
Data Reduction Algorithm types
There are four types of DataReductionAlgorithm settings::
top- if you want limit the data to values taken from the top of the dataset. The top first “count” values will be taken from the data set.bottom- if you want limit the data to values taken from the bottom of the dataset. The last “count” values will be taken from the data set.sample- reduce the dataset by a simple sampling algorithm limited to a “count” number of items. It means first and last items are included, as well as a “count” number of items having equal intervals between them. For example if you got a data set [0, 1, 2, … 100] and acount: 9then you will receive the following values [0, 10, 20 … 100]window- loads one ‘window’ of datapoints at a time containing “count” elements. Currentlytopandwindoware equivalent. There is work in progress to fully support a windowing setting.
Data Reduction Algorithm usage
DataReductionAlgorithm can be used in categorical, table or matrix dataview mapping.
For categorical data mapping it can be set into categories and/or group section of values.
Example 1
"dataViewMappings": {
    "categorical": {
        "categories": {
            "for": { "in": "category" },
            "dataReductionAlgorithm": {
                "window": {
                    "count": 300
                }
            }
        },
        "values": {
            "group": {
                "by": "series",
                "select": [{
                        "for": {
                            "in": "measure"
                        }
                    }
                ],
                "dataReductionAlgorithm": {
                    "top": {
                        "count": 100
                    }
                }
            }
        }
    }
}
For table dataview mapping the data reduction algorithm can be applied to the rows section.
Example 2
"dataViewMappings": [
    {
        "table": {
            "rows": {
                "for": {
                    "in": "values"
                },
                "dataReductionAlgorithm": {
                    "top": {
                        "count": 2000
                    }
                }
            }
        }
    }
]
For matrix dataview mapping the data reduction algorithm can be applied to the rows and/or columns section.