Debugging
This page shows some tips for debugging while building your visual.
Using breakpoints
Because the visual’s JavaScript is entirely reloaded every time the visual is updated, any breakpoints you add will be lost when the debug visual is refreshed. To work around this, use debugger statements in your code. It is recommended that you turn off auto-reload while using debugger in your code.
public update(options: VisualUpdateOptions) {
    console.log('Visual update', options);
    debugger;
    this.target.innerHTML = `<p>Update count: <em>${(this.updateCount++)}</em></p>`;
}
Showing Exceptions
When working on your visual you’ll notice that all errors are “eaten” by the Power BI service. This is an intentional feature of Power BI to prevent misbehaving visuals from causing the entire app to become unstable.
To work around this, you need to add code to programmatically catch and log your exceptions or just set your debugger to “break on caught exceptions”
Log exceptions programmatically
To log exceptions in your visual add the following code to your visual to define an exception logging decorator:
module powerbi.extensibility.visual {
    export function logExceptions(): MethodDecorator {
        return function (target: Object, propertyKey: string, descriptor: TypedPropertyDescriptor<Function>)
        : TypedPropertyDescriptor<Function> {

            return {
                value: function () {
                    try {
                        return descriptor.value.apply(this, arguments);
                    } catch (e) {
                        console.error(e);
                        throw e;
                    }
                }
            }
        }
    }
}
Then, you can use this decorator on any function to see error logging like this:
@logExceptions()
public update(options: VisualUpdateOptions) {
Break on exceptions
You can also set the browser to break on caught exceptions, which will stop code execution wherever an error happens and allow you to debug from there.
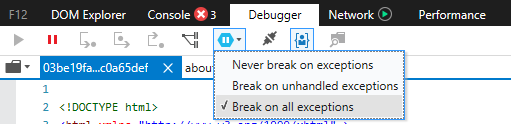
Edge
- Open developer tools (F12)
- Go to the
Debuggertab - Click the
break on exceptionsicon (hexagon with a pause symbol) - Select
Break on all exceptions
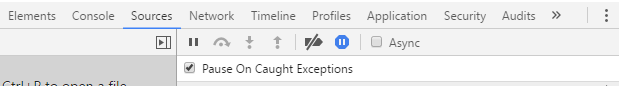
Chrome
- Open developer tools (F12)
- Go to the
Sourcestab - Click the
break on exceptionsicon (stop sign with a pause symbol) - Check the
Pause On Caught Exceptionscheckbox