Custom visuals unit test
Article describes how to write unit tests for Power BI Custom Visuals
Custom visuals unit test
The article is outdated, read updated article about unit tests in official documentation of Power BI.
This tutorial describes basics of writing unit tests for your custom visuals. In this tutorial, we will consider how to use test runner karma.js, testing framework - jasmine.js and also we will consider how to use powerbi-visuals-utils-testutils package. It is a set of mocks and fakes to simplify unit testing for Power BI custom visuals.
Install and configure karma.js and jasmine
Add required libraries into package.json at devDependencies section:
"@types/jasmine": "2.5.37",
"@types/jasmine-jquery": "1.5.28",
"coveralls": "2.11.15",
"jasmine": "2.5.2",
"jasmine-jquery": "2.1.1",
"karma": "1.3.0",
"karma-chrome-launcher": "2.0.0",
"karma-coverage": "1.1.1",
"karma-jasmine": "1.0.2",
"karma-remap-istanbul": "0.4.0",
"karma-sourcemap-loader": "0.3.7",
"karma-typescript-preprocessor": "0.3.0"
To find out more about the package see the description below.
Save package.json and execute on command line at package.json location:
npm install
The package manager will install all new packages added to package.json
For running unit tests we will need to configure the test runner. The sample of config you can find here
'use strict';

const recursivePathToTests = 'test/**/*.ts'
    , srcRecursivePath = '.tmp/drop/visual.js'
    , srcCssRecursivePath = '.tmp/drop/visual.css'
    , srcOriginalRecursivePath = 'src/**/*.ts'
    , coverageFolder = 'coverage';

module.exports = (config) => {
    const browsers = [];

    if (process.env.TRAVIS) {
        browsers.push('ChromeTravisCI');
    } else {
        browsers.push('Chrome');
    }

    config.set({
        browsers,
        customLaunchers: {
            ChromeTravisCI: {
                base: 'Chrome',
                flags: ['--no-sandbox']
            }
        },
        colors: true,
        frameworks: ['jasmine'],
        reporters: [
            'progress',
            'coverage',
            'karma-remap-istanbul'
        ],
        singleRun: false,
        files: [
            {
                pattern: 'data/*.csv',
                watched: true,
                served:  true,
                included: false
            },
            srcCssRecursivePath,
            srcRecursivePath,
            'node_modules/jquery/dist/jquery.min.js',
            'node_modules/jasmine-jquery/lib/jasmine-jquery.js',
            'node_modules/powerbi-visuals-utils-testutils/lib/index.js',
            recursivePathToTests,
            {
                pattern: srcOriginalRecursivePath,
                included: false,
                served: true
            }
        ],
        preprocessors: {
            [recursivePathToTests]: ['typescript'],
            [srcRecursivePath]: ['sourcemap', 'coverage']
        },
        typescriptPreprocessor: {
            options: {
                sourceMap: false,
                target: 'ES5',
                removeComments: false,
                concatenateOutput: false
            }
        },
        coverageReporter: {
            dir: coverageFolder,
            reporters: [
                { type: 'html' },
                { type: 'lcov' }
            ]
        },
        remapIstanbulReporter: {
            reports: {
                lcovonly: coverageFolder + '/lcov.info',
                html: coverageFolder,
                'text-summary': null
            }
        }
    });
};
You can modify this configuration if it is required.
Some settings of karma.conf.js:
-
recursivePathToTestsvariable locates place of code of tests -
srcRecursivePathvariable locates output JS code after compilling -
srcCssRecursivePathvariable locates output CSS after compilling less file with styles. -
srcOriginalRecursivePathvariable locates source code of your visual -
coverageFolder- variable determines a place where the report of coverage will be created.
Some properties of config:
-
singleRun: true- tests usually run on CI system. And it is enough to single one time. You can change tofalsefor debugging your tests. Karma will keep running browser, and it will allow you use the console to debug. -
files: [...]- in this array, you can set files for loading to the browser. Usually, there are source files, test cases, libraries (jasmine, test utils). You can add to list other files if you need. -
preprocessors- this section of config you configure actions, which executes before unit tests execution. There are precompiling of typescript to JS and preparing sourcemap files and generating code to generate code coverage report. You can disablecoveragefor debugging your tests. Coverage generates additional code for check code for the test coverage and it will complicate debugging tests.
Description of all configurations you can find in the documentation of karma.js
o convenient use, you can add test command into scripts:
"scripts": {
    "postinstall": "pbiviz update 1.5.0",
    "pbiviz": "pbiviz",
    "start": "pbiviz start",
    "typings":"node node_modules/typings/dist/bin.js i",
    "lint": "tslint -r \"node_modules/tslint-microsoft-contrib\"  \"+(src|test)/**/*.ts\"",
    "pretest": "pbiviz package --resources --no-minify --no-pbiviz --no-plugin",
    "test": "karma start"
},
Next step is adding references to jasmine framework, powerbi-visuals-utils-testutils, jquery and other libs.
Create test folder at the root of the project with _references.ts file. This file will contain references to typings and source code of unit tests:
// External
/// <reference path="../node_modules/@types/jquery/index.d.ts" />
/// <reference path="../node_modules/@types/jasmine/index.d.ts" />
/// <reference path="../node_modules/@types/jasmine-jquery/index.d.ts" />

// Power BI API
/// <reference path="../.api/v1.5.0/PowerBI-visuals.d.ts" />

// Power BI Extensibility
/// <reference path="../node_modules/powerbi-visuals-utils-testutils/lib/index.d.ts"/>

// The visual
/// <reference path="../.tmp/drop/visual.d.ts" />

// Test
/// <reference path="visualBuilder.ts" />
So, you are ready to begin writing your unit tests.
Simple unit test for check DOM element of the visual.
For testing visual, we must create an instance of visual.
Add visualBuilder.ts file into test folder with next code:
/// <reference path="_references.ts"/>

module powerbi.extensibility.visual.test {
    // powerbi.extensibility.utils.test
    import VisualBuilderBase = powerbi.extensibility.utils.test.VisualBuilderBase;

    // PBI_CV_9894B302_1DFF_4A96_ABFE_BF8588197166
    import VisualClass = powerbi.extensibility.visual.PBI_CV_9894B302_1DFF_4A96_ABFE_BF8588197166.BarChart;

    export class BarChartBuilder extends VisualBuilderBase<VisualClass> {
        constructor(width: number, height: number) {
            super(width, height);
        }

        protected build(options: VisualConstructorOptions) {
            return new VisualClass(options);
        }

        public get mainElement() {
            debugger;
            return this.element.children("svg.barChart");
        }
    }
}
There PBI_CV_9894B302_1DFF_4A96_ABFE_BF8588197166 is GUID of visual. You visual GUID must be different.
There is build method for creating an instance of your visual. mainElement is a get method which returns an instance of “root” DOM element in your visual. The getter is optional, but it makes writing unit test easier..
So, we have the builder of an instance of visual. Let’s write the test case. It will be a simple test case to check those SVG elements created when your visual displays.
Add visualTest.ts file for test cases with these code:
/// <reference path="_references.ts"/>

module powerbi.extensibility.visual.test {
    // powerbi.extensibility.visual.test
    import VisualBuilder = powerbi.extensibility.visual.test.BarChartBuilder;

    describe("BarChart", () => {
        let visualBuilder: VisualBuilder;
        let dataView: DataView;

        beforeEach(() => {
            visualBuilder = new VisualBuilder(500, 500);
        });

        it("root DOM element is created", () => {
            expect(visualBuilder.mainElement).toBeInDOM();
        });
    });
}
There are calling of several methods.
-
describemethod describes test case. In a context of jasmine framework often called suite or group of specs. -
beforeEachmethod will be called before each call ofitmethod, which defined inside ofdescribemethod. -
itdefines a single spec.itmethod should contain one or moreexpectations. -
expect- method creates expectation for a spec. A spec will succeed if will be passing all expectations and a spec with any failures of expectations will fail. -
toBeInDOM- it’s one of matchers method. About exists matchers you can read in documentation of jasmine framework.
Read more about jasmine framework in official documentation.
After that, you can run your simple unit test typing a command in command line tool.
This test checks that root SVG element of the visuals is created.
To run the unit test, you can type this command in the command line tool.
npm run test
Please note that Google Chrome has to be installed locally.
karma.js will run chrome browser and will execute the test case.
In command line you will get following output:
> karma start
23 05 2017 12:24:26.842:WARN [watcher]: Pattern "E:/WORKSPACE/PowerBI/PowerBI-visuals-sampleBarChart/data/*.csv" does not match any file.
23 05 2017 12:24:30.836:WARN [karma]: No captured browser, open http://localhost:9876/
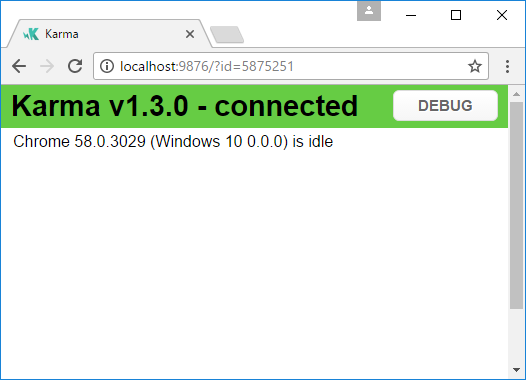
23 05 2017 12:24:30.849:INFO [karma]: Karma v1.3.0 server started at http://localhost:9876/
23 05 2017 12:24:30.850:INFO [launcher]: Launching browser Chrome with unlimited concurrency
23 05 2017 12:24:31.059:INFO [launcher]: Starting browser Chrome
23 05 2017 12:24:33.160:INFO [Chrome 58.0.3029 (Windows 10 0.0.0)]: Connected on socket /#2meR6hjXFmsE_fjiAAAA with id 5875251
Chrome 58.0.3029 (Windows 10 0.0.0): Executed 1 of 1 SUCCESS (0.194 secs / 0.011 secs)
=============================== Coverage summary ===============================
Statements : 27.43% ( 65/237 )
Branches : 19.84% ( 25/126 )
Functions : 43.86% ( 25/57 )
Lines : 20.85% ( 44/211 )
================================================================================
How to add static data for unit tests
Create visualData.ts file in testfolder. With these code:
/// <reference path="_references.ts"/>

module powerbi.extensibility.visual.test {
    import CustomizeColumnFn = powerbi.extensibility.utils.test.dataViewBuilder.CustomizeColumnFn;
    import TestDataViewBuilder = powerbi.extensibility.utils.test.dataViewBuilder.TestDataViewBuilder;

    export class SampleBarChartDataBuilder extends TestDataViewBuilder {
        public static CategoryColumn: string = "category";
        public static MeasureColumn: string = "measure";

        public constructor() {
            super();
            ...
        }

        public getDataView(columnNames?: string[], customizeColumns?: CustomizeColumnFn): DataView {
            let dateView: any = this.createCategoricalDataViewBuilder([
                ...
            ],
            [
                ...
            ], columnNames).build();

            //there is client side computed maxValue
            let maxLocal = 0;
            this.valuesMeasure.forEach((item) => {
                 if (item > maxLocal) {
                     maxLocal = item;
                 }
            });
            (<any>dataView).categorical.values[0].maxLocal = maxLocal;
        }
    }
}
The SampleBarChartDataBuilder class extends TestDataViewBuilder and implements abstract method getDataView.
When you put data into data field buckets Power BI produces a categorical dataview object based on your data.
In unit tests, you don’t have Power BI core functions to reproduce it. But you need to map your static data to categorical dataview. And TestDataViewBuilder class will help you in that.
Read more about DataViewMapping
In getDataView method you just call createCategoricalDataViewBuilder method with your data.
In sampleBarChart visual capabilities.json we have a dataRoles and dataViewMapping objects:
"dataRoles": [
    {
        "displayName": "Category Data",
        "name": "category",
        "kind": "Grouping"
    },
    {
        "displayName": "Measure Data",
        "name": "measure",
        "kind": "Measure"
    }
],
"dataViewMappings": [
    {
        "conditions": [
            {
                "category": {
                    "max": 1
                },
                "measure": {
                    "max": 1
                }
            }
        ],
        "categorical": {
            "categories": {
                "for": {
                    "in": "category"
                }
            },
            "values": {
                "select": [
                    {
                        "bind": {
                            "to": "measure"
                        }
                    }
                ]
            }
        }
    }
],
To generate the same mapping you must set the following params to createCategoricalDataViewBuilder method:
[
    {
        source: {
            displayName: "Category",
            queryName: SampleBarChartData.ColumnCategory,
            type: ValueType.fromDescriptor({ text: true }),
            roles: {
                Category: true
            },
        },
        values: this.valuesCategory
    }
], [
    {
        source: {
            displayName: "Measure",
            isMeasure: true,
            queryName: SampleBarChartData.MeasureColumn,
            type: ValueType.fromDescriptor({ numeric: true }),
            roles: {
                Measure: true
            },
        },
        values: this.valuesMeasure
    },
], columnNames
Where this.valuesCategory array of categories.
public valuesCategory: string[] = ["Monday", "Tuesday", "Wednesday", "Thursday", "Friday", "Saturday", "Sunday"];
and this.valuesMeasure array of measure for each category. Example:
public valuesMeasure: number[] = [742731.43, 162066.43, 283085.78, 300263.49, 376074.57, 814724.34, 570921.34];
Now, you can use SampleBarChartDataBuilder class in your unit test.
ValueType class defined in powerbi-visuals-utils-testutils package. And
createCategoricalDataViewBuilder method requires lodash library.
You need to add these packages to dependencies
In package.json at devDependencies section
"lodash": "4.16.2",
"powerbi-visuals-utils-testutils": "0.2.2"
In karma.conf.js at files section
'node_modules/lodash/lodash.min.js',
'node_modules/powerbi-visuals-utils-typeutils/lib/index.js',
In test\_references.ts file at Power BI Extensibility section
/// <reference path="../node_modules/powerbi-visuals-utils-typeutils/lib/index.d.ts"/>
You will need to call
npm install
to install lodash library.
Now, you can run the unit test again. You must get this output
> karma start

23 05 2017 16:19:54.318:WARN [watcher]: Pattern "E:/WORKSPACE/PowerBI/PowerBI-visuals-sampleBarChart/data/*.csv" does not match any file.
23 05 2017 16:19:58.333:WARN [karma]: No captured browser, open http://localhost:9876/
23 05 2017 16:19:58.346:INFO [karma]: Karma v1.3.0 server started at http://localhost:9876/
23 05 2017 16:19:58.346:INFO [launcher]: Launching browser Chrome with unlimited concurrency
23 05 2017 16:19:58.394:INFO [launcher]: Starting browser Chrome
23 05 2017 16:19:59.873:INFO [Chrome 58.0.3029 (Windows 10 0.0.0)]: Connected on socket /#NcNTAGH9hWfGMCuEAAAA with id 3551106
Chrome 58.0.3029 (Windows 10 0.0.0): Executed 1 of 1 SUCCESS (1.266 secs / 1.052 secs)

=============================== Coverage summary ===============================
Statements   : 56.72% ( 135/238 )
Branches     : 32.54% ( 41/126 )
Functions    : 66.67% ( 38/57 )
Lines        : 52.83% ( 112/212 )
================================================================================
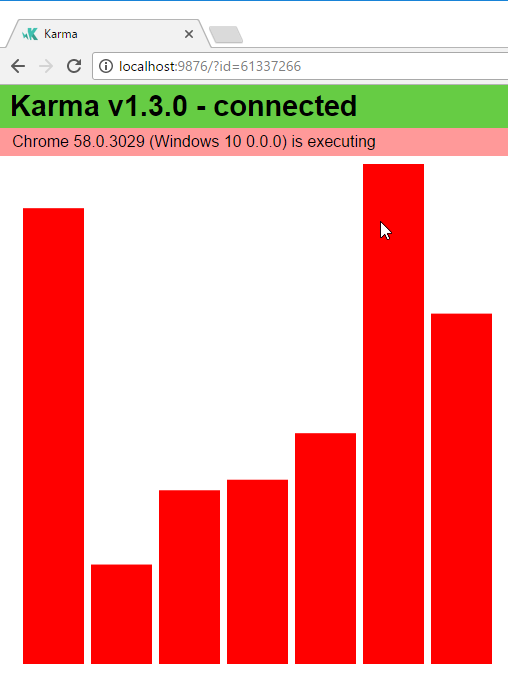
And you must see started Chrome Browser with your visual.
Make attention coverage summary increased. Please open coverage\index.html to find out more about current code coverage
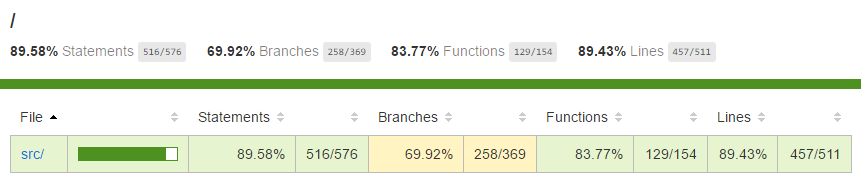
Or in scope of src folder
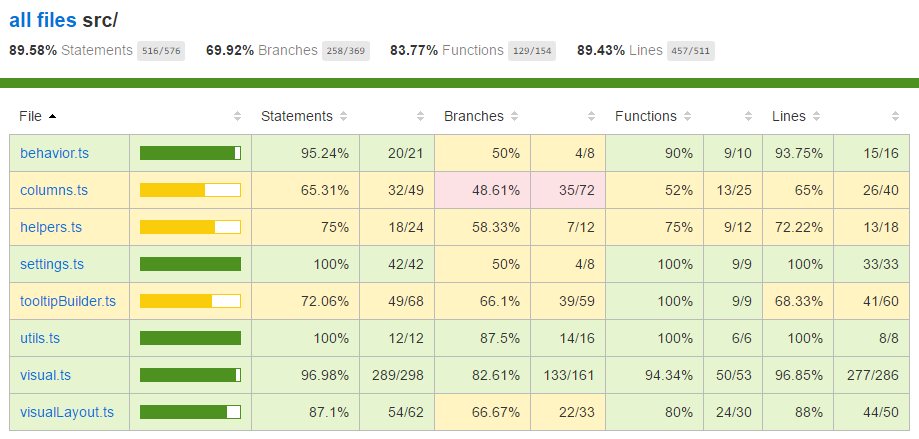
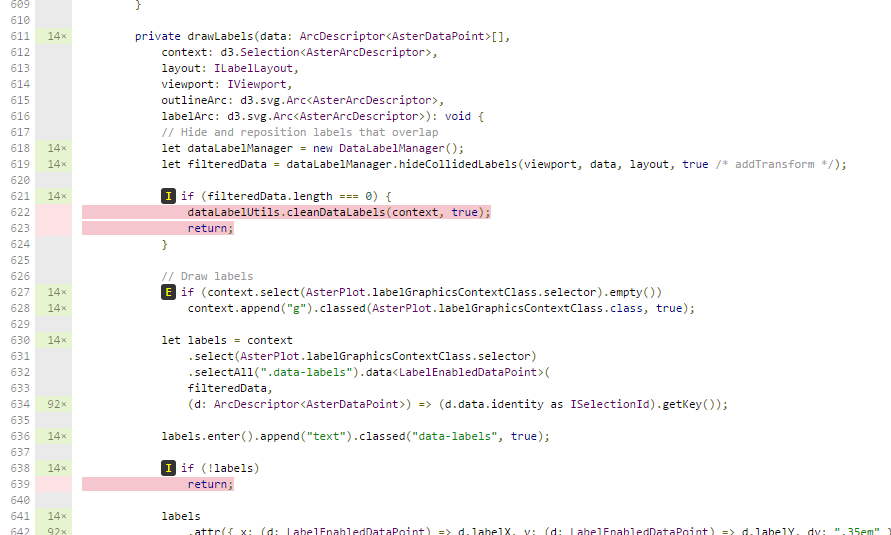
In the scope of file, you can look at source code. Coverage utils would mark row background to red if a code were not executed during running of unit tests.
But code coverage doesn’t mean that you have good functionality coverage of visual. One simple unit test provided over 96% of coverage in src\visual.ts.
##