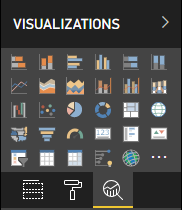
Analytics pane
The article is outdated, read updated article about analytics pane in official documentation of Power BI.
Analytics pane was introduced for native visuals on November 2018. As of API v2.5.0, custom visuals too can present and manage their properties in the Analytics pane.

This is handled similarly to managing properties in the Format pane, by defining an object in the visual’s capabilities.json file.
The differences are as follows:
-
Under the
object’s definition, add anobjectCategoryfield with a value of 2. Note: theobjectCategoryfield is an optional field introduced in API 2.5.0. It defines the aspect of the visual that the object controls (1 = Formatting, 2 = Analytics). “Formatting” is used for look-and-feel, colors, axes, labels etc. “Analytics” is used for forecasts, trendlines, reference lines and shapes etc. objectCategory defaults to “Formatting” if omitted. -
The object must have the two following properties: 1.
showof type bool, with default value of false. 2.displayNameof type text. The default value you’ll choose will become the instance’s initial display name.
"objects": {
  "YourAnalyticsPropertiesCard": {
    "displayName": "Your analytics properties card's name",
    "objectCategory": 2,
    "properties: {
      "show": {
        "type": {
          "bool": true
        }
      },
      "displayName": {
        "type": {
          "text": true
        }
      },
    ... //any other properties for your Analytics card
    }
  }
...
}
Any other properties may be defined in the same way as done for Format objects. Object enumeration is done exactly the same as in Format pane.
Known limitations and issues
- No multi-instance support yet (coming soon). Objects cannot have a selector other than static (i.e. “selector”: null), and custom visuals can’t have user-defined multiple instances of a card.
- Properties of type
integerare not displayed correctly. As a workaround, use typenumericinstead.
As a general guideline, and on par with out-of-the-box visuals, please use the Analytics pane only for objects that add new information or shed new light on the presented information. For instance, dynamic reference lines illustrating important trends. Any options that control the look-and-feel of the visual, i.e. formatting, should be kept in the Formatting pane.
