Adding tooltips to custom visual
Adding Report Page Tooltips support to Bar Chart
The article is outdated, read updated article about report page tooltips in official documentation of Power BI.
Report page tooltips support can be done by updating your visual capabilities. See commit for what was added at this step.
To add report page tooltips support, most changes will be located in capabilities.json. A sample schema is already in place for you.
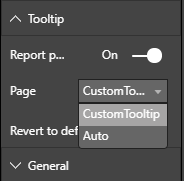
Report page tooltips definition can be done on the Format pane.
Support Canvas Tooltips
To support displaying report page tooltips, add “tooltips” definition to capabilities.json as follows
"tooltips": {
        "supportedTypes": {
            "default": true,
            "canvas": true
        },
        "roles": [
            "tooltips"
        ]
}
supportedTypes is the tooltips configuration supported by the visual and reflected on the field well.
default specifies whether the “automatic” tooltips binding via data field is supported.
canvas specifies whether the report page tooltips are supported.
roles optional. Once defined, instructs what data roles will be bound to the selected tooltip option in fields well.
For more information, see the Report Page Tooltips usage guidlines Report Page Tooltips.
Applying report page tooltips
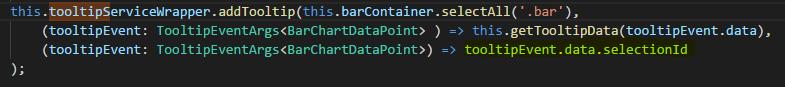
For displaying the report page tooltip, upon calling ITooltipService.Show(options: TooltipShowOptions) or ITooltipService.Move(options: TooltipMoveOptions), the PowerBI host will consume the selectionId (‘identities’ property of ‘options’ argument above). Therefore, the SelectionId should represent the selected data (category, series, etc) of the item you hovered above to be retreived by the tooltip.
See more on building SelectionId under Adding Selection and Interactions with Other Visuals
Example of sending the selectionId to tooltip display calls: