Adding Databinding to the Bar Chart
Step by step guide how to build simple Bar Chart Visual
Adding Databinding to Bar Chart
Databinding can be done by defining your visual capabilities. See commit for what was added at this step.
To add databinding, all changes will be located in capabilities.json. A sample schema is already in place for you.
Databinding can be done on the field well.
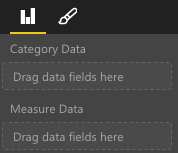
Adding Data Roles
Currently, data roles are added for you, but customizations can still be made.
displayName is the name shown on the field well.
name is the internal name used to reference this data role.
0 for the kind property refers to the grouping or category. Groupings resemble a discrete number of values.
1 for the kind property refers to the values for each of the groupings.
"dataRoles": [
    {
        "displayName": "Category Data",
        "name": "category",
        "kind": 0
    },
    {
        "displayName": "Measure Data",
        "name": "measure",
        "kind": 1
    }
],
For more information, see the section about Data Roles.
Adding Conditions to DataViewMapping
Define conditions within your dataViewMappings to determine how many fields can be bound for each field well.
Use the internal name defined in your dataRoles to reference each field.
    "dataViewMappings": [
        {
            "conditions": [
                {
                    "category": {
                        "max": 1
                    },
                    "measure": {
                        "max": 1
                    }
                }
            ],
        }
    ]
For more information, see the section about Data View Mapping.
Defining and Using visualTransform
DataView is the structure that PowerBI provides to your visual and it contains the queried data to be visualized. However, DataView provides your data in different forms such as categorical and table forms. In this instance we’re building a categorical visual and we will only need the use the categorical property on the DataView.
Defining visualTransform will allow you to convert DataView into a view model your visual will use. IVisualHost is required because when defining individual data points, you will want to assign colors and selection to them.
/**
 * Function that converts queried data into a view model that will be used by the visual
 *
 * @function
 * @param {VisualUpdateOptions} options - Contains references to the size of the container
 *                                        and the dataView which contains all the data
 *                                        the visual had queried.
 * @param {IVisualHost} host            - Contains references to the host which contains services
 */
function visualTransform(options: VisualUpdateOptions, host: IVisualHost): BarChartViewModel {
    /*Convert dataView to your viewModel*/
}
See commit for what was added to visualTransform