Getting started
Step by step guide how to build React-based Custom Visual
This tutorial explains you how to create the simplest custom visual using React, displaying single value in a circle. It will have adaptive size and settings to customize it.
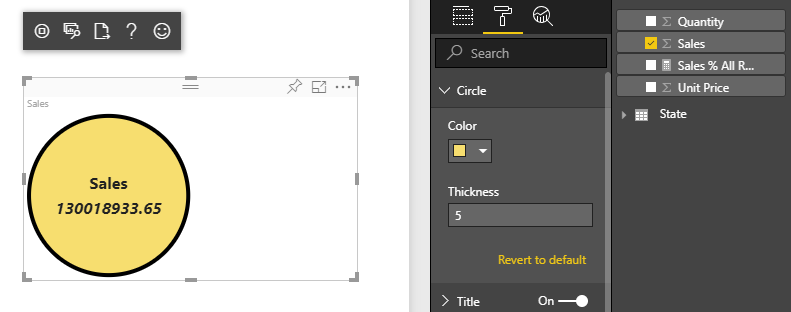
CircleCard visual
You can clone or download the full source code of that visual from GitHub.
Starting with default template
If this is your first custom visual, please read how to set up developer environment first. You need only the part describing the developer environment set up.
- Create basic PowerBI Custom Visual
pbiviz new ReactCircleCard - Step into new folder and launch Visual Studio Code
cd ./ReactCircleCard; code . - Start developer server for your custom visual.
pbiviz start
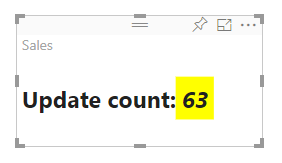
This basic visual represents updates count. Let’s transform it to a circle card, which will represent some singular measure and its title using React JS.