Creating R Powered Custom Visual with HTML output
Building R Powered Custom Visual
Regular R Powered Custom Visual capture the output plot and displays it as a static image, the same way it is done in R Visuals. In order to create an HTML output the “rhtml” template is used for creating a basic project:
pbiviz new sampleRHTMLVisual -t rhtml
This template includes a very basic ready to run R Visual that can create HTML output:
source('./r_files/flatten_HTML.r')

############### Library Declarations ###############
libraryRequireInstall("ggplot2");
libraryRequireInstall("plotly")
####################################################

################### Actual code ####################
g = qplot(`Petal.Length`, data = iris, fill = `Species`, main = Sys.time());
####################################################

############# Create and save widget ###############
p = ggplotly(g);
internalSaveWidget(p, 'out.html');
####################################################
This R script calls a function from ggplot2 package, which plots a pre-defined dataset, and is using the Plotly package for converting it into HTML.
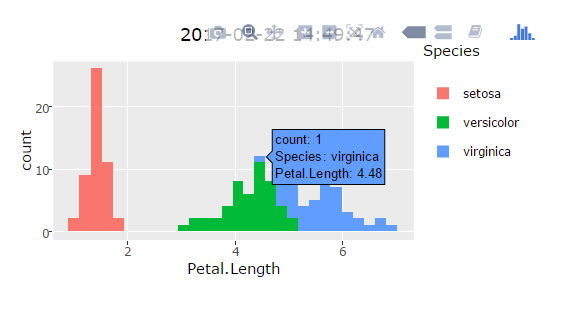
In this sample the HTML has several capabilities, such as displaying data values and enables zooming.
Creating HTML output in R
In order to create HTML output in R we are using the HTMLWidgets package. It supports saving to HTML of output which was created by other packages. In the sample we used ggplot2 and plotly, but other packages are also supported. See the full list of supported R Packages in the service.
The output is created as a widget which is saved to HTML file. The system supports the creation of a single file, without external dependencies. The function internalSaveWidget is saving the widget and merge all the external files into a single one (it supports only several packages, such as plotly and networkD3).
Tips and best practice
General tips
- The suffix of the output file must be ‘html’.
- For better performance, reduce the size of the created HTML (i.e. plotting data after processing and aggregation)
- All the features of R Powered Custom Visuals are supported, including properties in the Property Pane.
Loading the head data once
In many cases, the custom visual is using the same package for all rendering. In these cases the same scripts are being loaded to the head section of the HTML, while the main differernce is in the body section.
There is a flag in visual.ts which can choose between updating the head section after each load or only in the first one:
const updateHTMLHead: boolean = false;
The default is false, which means that the scripts will only be loaded to the DOM once.