Starting a simple R Script
Building R Powered Custom Visual
When creating a R Powered Custom Visual, the template “rvisual” creates a file in the root folder of the visual called “script.r”. This file will hold the R script you want to execute to generate the image the user will see.
In this stage, we will change the default R script to start using the Corrplot package. We will follow the corrplot introduction from cran.r-project.org
Editing the R Script
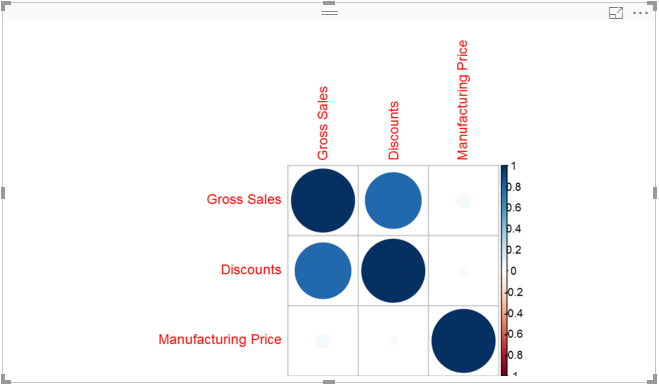
Open the script.r file and paste the following code:
library(corrplot)
M <- cor(Values)
corrplot(M, method="circle")
Now add the corrplot package to the CRAN dependencies of this visual in the dependencies.json file:
{
  "cranPackages": [
    {
      "name": "corrplot",
      "displayName": "corrplot",
      "url": "https://cran.r-project.org/web/packages/corrplot/"
    }
  ]
}
Now you can package the visual and try it out (or you can use the pbiviz start feature to debug the visual in PowerBI.com)
See commit for what was added at this step.