Funnel Plot from R script to R Custom Visual in Power BI
Story about the “Funnel Plot”
This article from The Gaurdian tells us the inspiring story about how using the wrong visualization tools can lead to the wrong conclusion. The real hero of this story is the funnel plot, which can be used for comparing institutional performance and medical data analysis.
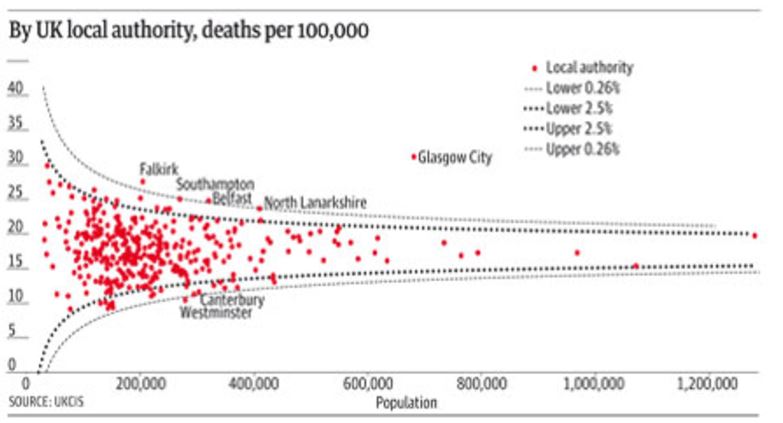
The funnel plot is easy to consume and interpret. The “funnel” is formed by confidence limits and show the amount of expected variation. The dots outside the funnel are outliers.
In this blog the author demonstrates the implementation of “funnel plot” in R, and we will use it as a starting point.
We are going to use this code in order to incrementally create:
- R-script for RStudio
- R-visual in Power BI
- R-powered Custom Visual in Power BI (PNG-based)
- R-powered HTML-based Custom Visual in Power BI
Chapter 1
The minimal R script and the accompanying data table:
The next version of R script is essentially the same, but implements input error handling and user parameters to control the appearance of the plot:
All the code is in chapter1_R
Chapter 2
Let us load the “dataset.csv” into Power BI desktop workspace as “Cancer Mortality” table.
The code in “script_R_v1_01.r” is almost ready to be used within R-visual.
We only need to comment out the read.csv call.
The resulting R-code is:
chapter2_Rvisual/script_RV_v2_00.r
See the result in:
chapter2_Rvisual/funnelPlot_Rvisual.pbix
Remark: The dataset is hard-coded name for the input data.frame of any R-visual.
Chapter 3
We are about to package R code in R-powered Custom Visual. Before you can get started you’ll need to install the PBIVIZ tools. This should not take long. Follow the instructions here
Section 3.1
Now we will use any command line shell (like “Command Prompt”) to create new R-powered custom visual:
> pbiviz new funnelRvisual -t rvisual
> cd funnelRvisual
> npm install
> pbiviz package
It will create funnelRvisual folder with initial template visual (-t stands for template).
The PBIVIZ is in “dist” folder. Try to import it into Power BI and see what it does. The R-code is inside “script.r” file.
- Open “script.r” file for editing and replace its contents with “script_RV_v2_00.r” just as is!
- Open “capabilities.json” in any editor and Find/Replace the
Valuesstring bydatasetstring. It replaces the name of “Role” in template to be like in R-code. See before vs. after - Optionally: open “dependencies.json” in any editor and add one section for each R package required in your R script. This will tell Power BI to automatically import those packages when the visual is loaded for the first time. See before vs. after
Now re-package the visual again:
> pbiviz package
Try to import it into Power BI again and see what it does.
The resulting PBIX and the whole Custom Visual Project from this section may be found in:
chapter3_RCustomVisual/funnelPlot_RCustomVisual.pbix
chapter3_RCustomVisual/funnelRvisual_v01
Section 3.2
The Custom Visual in previous section is good to go, but it is not really user-friendly.
Because user has to know the order of columns in input table.
Let us divide the input field dataset into 3 fields (roles): Population, Number and Tooltips.
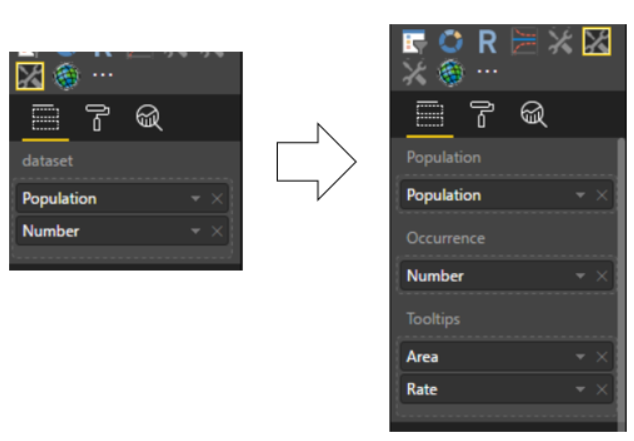
- Edit “capabilities.json” by replacing
datasetrole by three new roles. You will need to update 2 sections:dataRolesanddataViewMappings
These sections define names, types, tooltips and maximum columns for each input field. See more information here.
The resulting file is
chapter3_RCustomVisual/funnelRvisual_v02/capabilities.json. See before vs. after
- Edit “script.r” to support Population, Number and Tooltips as input dataframes instead of dataset
The resulting file is chapter3_RCustomVisual/funnelRvisual_v02/script.r. See before vs. after
To follow the changes in R-script, search for the commented blocks:
#RVIZ_IN_PBI_GUIDE:BEGIN:Added to enable custom visual fields
...
#RVIZ_IN_PBI_GUIDE:END:Added to enable custom visual fields
and
#RVIZ_IN_PBI_GUIDE:BEGIN:Removed to enable custom visual fields
...
#RVIZ_IN_PBI_GUIDE:END:Removed to enable custom visual fields
Now re-package the visual again:
> pbiviz package
Try to import it into Power BI again and see what it does.
The resulting PBIX and the whole Custom Visual Project may be found in:
chapter3_RCustomVisual/funnelRvisual_v02
Section 3.3
The Custom Visual in previous section is almost perfect, but something is still missing. What is it? Of course, it is user parameters.
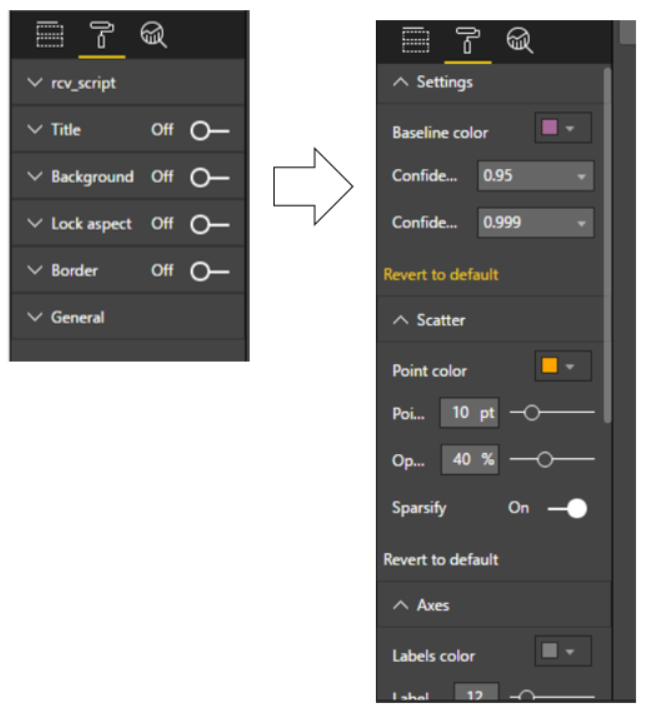
The user obviously wants to control colors and sizes of visual elements as well as some internal parameters of algorithm from the UI. Let’s add this capability:
- We need to edit “capabilities.json” again, this time the objects section. Read more about objects section here.
This is the place to define names, tooltips and types of each parameter. We also decide on the partition of parameters into groups (three groups in this case).
The resulting file is
chapter3_RCustomVisual/funnelRvisual_v03/capabilities.json See before vs. after
- Now edit the “src/settings.ts” file.
This file is written in TypeScript. Don’t worry, it is easy to use this example as a template.
To follow the changes in TypeScript, search for the commented blocks:
//RVIZ_IN_PBI_GUIDE:BEGIN:Added to enable user parameters
...
//RVIZ_IN_PBI_GUIDE:END:Added to enable user parameters
The resulting file is chapter3_RCustomVisual/funnelRvisual_v03/src/settings.ts
You will find two blocks of code added.
- Declare new interface to hold the property value;
- Define a member property and default values;
See before vs. after
- Now edit “script.r” to support the parameters in UI, it is quite easy just by adding
if.existscalls per user-parameter
The resulting file is:
chapter3_RCustomVisual/funnelRvisual_v03/script.r
To follow the changes in the R script, search for the commented code blocks:
#RVIZ_IN_PBI_GUIDE:BEGIN:Added to enable user parameters
 ...
#RVIZ_IN_PBI_GUIDE:END:Added to enable user parameters
and
#RVIZ_IN_PBI_GUIDE:BEGIN:Removed to enable user parameters
 ...
#RVIZ_IN_PBI_GUIDE:END:Removed to enable user parameters
See before vs. after
Note that you may decide not to expose some of the parameters to UI, like we did.
Now re-package the visual again:
> pbiviz package
Try to import it into Power BI again and see what it does.
The resulting PBIX and the whole Custom Visual project in this section may be found in:
chapter3_RCustomVisual/funnelRvisual_v03
Remark: In this tutorial we add parameters of several types (boolean, numeric, string, color) at once. If you find it too complicated to follow, please have a look at this example, which shows how to add single parameter.
Chapter 4
Section 4.1
The resulting visual is PNG-based and therefore not responsive to mouse hover, can not be zoomed in etc., In the last step we will show how it can be converted to HTML-based visual. We will create an empty R-powered HTML-based Cutom Visual template and then copy some scripts from PNG-based custom visual project.
Use command line:
> pbiviz new funnelRHTMLvisual -t rhtml
> cd funnelRHTMLvisual
> npm install
> pbiviz package
Explore “capabilities.json” and pay attention to "scriptOutputType": "html" line.
Explore “dependencies.json” and pay attention to names of R-packages listed there.
Explore “script.r” and pay attention to its structure. You may open and run it in RStudio. It does not use external input. You will find that it creates and saves “out.html” file. The file will have to be self-contained (without external dependencies) and defines graphics inside HTML widget.
To help htmlWidgets users we also provide R-utilities in “r_files” folder to help with conversion of plotly or widget object into self-content HTML.
Note that this version of R-powered visual supports source command (unlike previous types of visuals) and we will use it to make code more readable.
- Replace template “capabilities.json” by “capabilities.json” from previous step, but obviously keep:
"scriptOutputType": "html"
The resulting file is: chapter4_RHTMLCustomVisual/funnelRHTMLvisual_v01/capabilities.json
- Merge latest version of the “sript.r” file from Chapter 3 with “script.r” from the template.
What are the changes? We use plotly package to convert ggplot object to plotly object. Next we use htmlWidgets package to save it to HTML-file.
We also move most of utility functions to “r_files/utils.r” and add generateNiceTooltips function for cosmetics of plotly object
The resulting file is
chapter4_RHTMLCustomVisual/funnelRHTMLvisual_v01/script.r See before vs. after 1, 2
To follow the changes in R-script, search for the blocks:
#RVIZ_IN_PBI_GUIDE:BEGIN:Added to create HTML-based
 ...
#RVIZ_IN_PBI_GUIDE:BEGIN:Added to create HTML-based
and
#RVIZ_IN_PBI_GUIDE:BEGIN:Removed to create HTML-based
...
#RVIZ_IN_PBI_GUIDE:BEGIN:Removed to create HTML-based
- Merge latest version of the “dependencies.json” file from Chapter 3 with “dependencies.json” from the template, to include new R-package dependencies
The resulting file is chapter4_RCustomVisual/funnelRHTMLvisual_v01/dependencies.json
-
Change the script “src/settings.ts” in exactly the same way as you did in Chapter 3.3
-
Now re-package the visual again:
> pbiviz package
Try to import it into Power BI again and see what it does.
The resulting PBIX and the whole Custom Visual Project may be found in:
chapter4_RCustomVisual/funnelRHTMLvisual_v01
Section 4.2: Bonus example.
The resulting project in the previous section is bloated relative to the initial template. This is due to the incremental changes we’ve made during the tutorial. If we start from an empty project, it will be much less bloated. Create an empty project:
> pbiviz new smallRHTML -t rhtml
> cd smallRHTML
> npm install
> pbiviz package
Take code from this showcase and make changes to it.
The changes for the HTML-based visual are highlighted
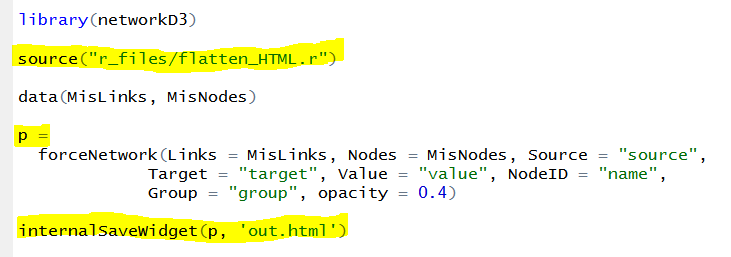
Just copy it instead of your template script.r and run pbiviz package again. Now you get this cool visual in your Power BI report!
Section 4.3: HTML widgets gallery
Dozens of visuals from this stunning gallery of html widgets are ready to become your next custom visual. To make it easier, we created this single custom visual project:
chapter4_RCustomVisual/multipleRHTML
It contains more than 20 interactive HTML visuals !!!
Sample of htmlWidgets1:

Sample of htmlWidgets2:

Try it out in PBIX file. You can switch between html widgets via Format > Settings > Type.
If you decide to use it as a starting point for your custom visual:
- Download the whole folder
- Edit script.r and dependencies.json to keep only one widget
- Edit capabilities.json and settings.ts to remove
Typeselector - Change
const updateHTMLHead: boolean = true;tofalsein visual.ts (performance) - Change metadata in pbiviz.json, particularly
"guid"field - Re-package and continue the development of Custom Visual as explained in previous chapter
- Remark: Not all of the widgets in this project are supported in service yet.
Quick Summary of R-powered Custom Visuals
Let’s recap main steps for creation and perfection of R-powered custom visual from scratch:
- Start with a working R-script
- Install all required components: NodeJS and powerbi-visuals-tools
- Create new template custom visual
- Edit the key files:
- Edit script.r and capabilities.json to create basic working custom visual
- Edit script.r and capabilities.json to allow for multiple input fields (if required)
- Edit script.r and capabilities.json and settings.ts to allow user parameters (if required)
- Edit dependencies.json and pbiviz.json and icon.png as final touches to your custom visual
- Package the visual and share it with the community
Tips and Tricks
- We recommend that developers edit “pbiviz.json” to contain correct metadata (such as version, email, name, license type etc.)
IMPORTANT: the "guid" field is an unique identifier for custom visual. You should be creating new project for every different visual, so the GUID will be different for each visual. It will only be the same if you are copying an old project when you create a new visual, which you should not do.
-
Edit “assets/icon.png” to create a cool, unique icon for your custom visual.
-
In order to be able to debug your R-code in RStudio with exactly same data as you have in Power BI report, add the following code in the beginning of the R-script (edit
fileRdavariable):
#DEBUG in RStudio
fileRda = "C:/Users/yourUserName/Temp/tempData.Rda"
if(file.exists(dirname(fileRda)))
{
  if(Sys.getenv("RSTUDIO")!="")
    load(file= fileRda)
  else
    save(list = ls(all.names = TRUE), file=fileRda)
}
This code saves the environment from Power BI report and loads it in RStudio.
-
You do not need to develop R-powered Custom Visuals from scratch. All the code is available in github. Select the visual which is the most similar to the one you want to develop. Again, you should not be copying the entire project. If you want to reuse the functionality across visuals, copy the core code across into a new project. For example, you can start from the spline custom visual.
-
Keep in mind, that each R visual and R Custom Visual applies
uniqueoperator to the input table. To avoid the identical rows being removed, consider adding an extra input field with a unique ID and just ignore it in R code. -
If you have Power BI account, you can use Power BI service to develop your visual on-the-fly instead of re-packaging it with
pbiviz packagecommand. -
And finally we recommend developers to submit their R-powered custom visuals to the store. It’s a great way to increase your brand recognition and get your work out into the public sphere..
Useful links:
R-script showcase: https://community.powerbi.com/t5/R-Script-Showcase/bd-p/RVisuals
Office Store (gallery): https://store.office.com/en-us/appshome.aspx?ui=en-US&rs=en-US&ad=US&clickedfilter=OfficeProductFilter%3aPowerBI&productgroup=PowerBI
Custom Visuals Documentation: https://github.com/Microsoft/PowerBI-visuals
Basic tutorial on R-custom visuals: https://github.com/Microsoft/PowerBI-visuals/tree/master/RVisualTutorial
Develop and submit custom visuals to the store: https://powerbi.microsoft.com/en-us/documentation/powerbi-developer-office-store/