Creating a new R Powered Custom Visual
Building R Powered Custom Visual
In order to create a new R Powered Custom Visual we will run the following command:
pbiviz new sampleCorrPlotRVisual -t rvisual
This command will create a new folder stracture based on the template rvisual
This template includes a very basic ready to run R Visual which will actually run the following R script:
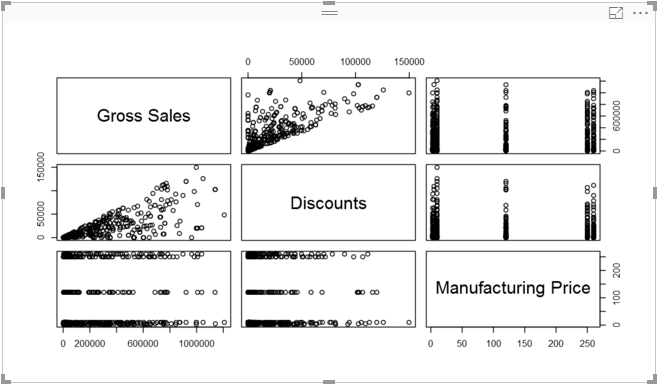
plot(Values)
This R script calls a generic function for plotting of R object. The data frame “Values” will contain columns in “Values” data role.
See commit for what was added at this step.
Enable HTML output
The static output image can be replaced by an HTML output, unlocking new possibilities to R powered custom visuals. The ‘rhtml’ template is used in this case:
pbiviz new sampleRHTMLVisual -t rhtml
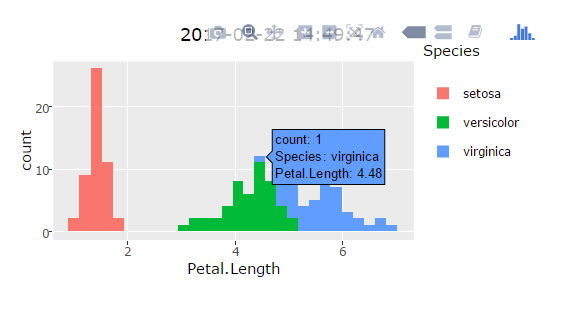
In this sample the HTML has several capabilities, such as displaying data values and enables zooming.
For more information see R HTML See commit for what was added at this step.