PowerBI Visual Tools (pbiviz) - Usage Guide
Getting Started
The easiest way to create custom visuals is by using the PowerBI command line tools which can be easily installed via NPM. The command line tools provide everything you need to develop visuals and test them in live PowerBI reports and dashboards.
Features:
- Visual project generation
- TypeScript compilation
- Less compilation
- Automatic live reload
- pbiviz packaging (for distribution)
Creating a new visual
You can create a new visual project with a single command.
pbiviz new My Visual Name
Replace “My Visual Name” with the name of your visual. You can change this later by modifying the generated pbiviz.json file.
This command will create a new folder in your current directory and generate a basic ‘sample template’ for your visual.
Once it finishes you also need to download all dependencies listed in the package.json file using this command from within the newly created folder:
npm install
Note: This command should also be executed if you download and build an already existing visual.
Then use your favorite editor to start working on your new visual.
Testing your visual in PowerBI
You can easily test your visual live in reports and dashboards in the PowerBI service using the live developer visual, once it’s enabled. To enable live preview of your custom visual follow these steps
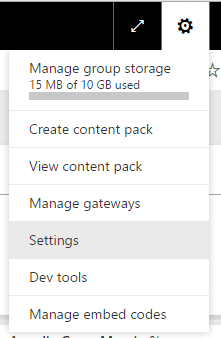
Step 1
- Go to
Settingsin the gear menu
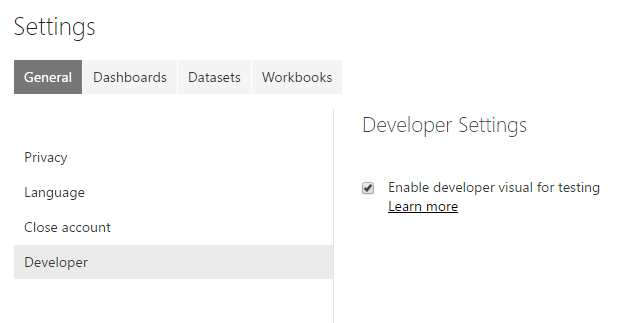
Step 2
- Click on
Developer - Check the
Enable developer visual for testingcheckbox
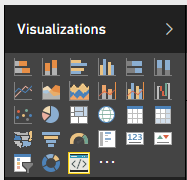
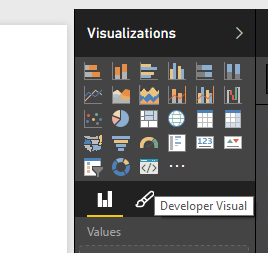
Step 3
- Select the
Developer Visualin the Visualizations pane
Step 4
- Select the visual in the report canvas
- Bind data like normal
- Begin developing your visual (make sure
pbiviz startis running)
Running your visual
To run your visual navigate to the root of your visual project (the directory containing pbiviz.json) and type pbiviz start to build and serve the visual.
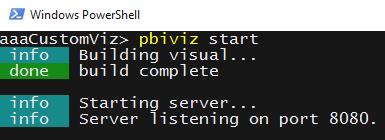
This command will compile your typescript and less files and bundle them for testing. It also launches an https server that will serve your visual for testing in your favorite web browser.
Viewing your visual in PowerBI
To view your visual, go to your desired report and add the debug visual.
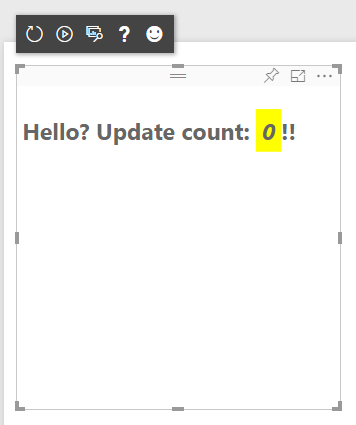
Once your server is started, you will see the default template as your visual.
Toolbar icons (left to right)
- Refresh Visual - Manually the visual (if auto reload is off)
- Toggle Auto Reload - When turned on the visual will automatically update every time you save a file
- Show DataViews - Shows the visual’s underlying dataview for debugging
- Get Help - Links to this documentation
- Send Feedback - We’re always trying to improve the experience so let us know about yours
Packaging your visual for distribution
Before you can load your visual into PowerBI Desktop or share it with the community in the PowerBI Visuals Marketplace you’ll need to generate a pbiviz file.
To package your visual navigate to the root of your visual project (the directory containing pbiviz.json) and use the following command to generate a pbiviz file.
pbiviz package
This command will create a pbiviz file in the dist/ directory of your visual project. If there is already a pbiviz file (from previous package operations) it will be overwritten.
Updating visuals API
When you create a visual using pbiviz new a copy of the appropriate api type definitions and json schemas is copied into your visual directory. You can use the pbiviz update command to update these files if needed. This can be useful if we release a fix for a past API version or if you want to update to the latest API version.
Updating your existing API version
If we release an update to an existing API you can get the latest version by doing the following.
#Update your version of pbiviz
npm install -g powerbi-visuals-tools

#Run update from the root of your visual project (where pbiviz.json is located)
pbiviz update
This will download the latest tools from npm (which includes the updated type definitions and schemas) and pbiviz update will overwrite the version in your visual with the latest version. NOTE: This will maintain the api version your visual already uses (specified in your pbiviz.json file). If you want to upgrade to a more recent version, follow the steps below.
Upgrading to a different API version
You can update to a different api version by using the same steps, but explicitly specifying an API version in the update command.
#Update your version of pbiviz
npm install -g powerbi-visuals-tools

#Run update from the root of your visual project (where pbiviz.json is located)
pbiviz update 1.12.0
This would update your visual to api version 1.12.0, the current version of the api, which supports TypeScript version 2.3.3.
API VERSION WARNING The default API version used by the tools will always be the stable version of the API. Any later versions are unstable, subject to change, and may behave differently in different environments (service vs desktop). For the current stable API version see the Change Log for information about pre-release versions see the Roadmap
Troubleshooting
Pbiviz command not found (or similar errors)
If you run pbiviz in your terminal / command line you should see the help screen. If not, it is not installed correctly.
More Info: Installation Guide
Cannot find debug visual
The debug visual should be the last icon in the visualizations pane (right side) of the report view. If you don’t see it ensure you’ve enabled it in settings.
NOTE: The debug visual is currently only available in the PowerBI Service (not in desktop or mobile). The packaged visuals will still work everywhere.
Can’t contact visual server
Run the visual server by typing pbiviz start in terminal / command line from the root of your visual project (see above)
If your server is already running it’s likely your SSL certificates weren’t installed correctly.
More Info: How to install the local SSL certificates