Task 4.1: Persistence attack detection
The next steps are done with a different machine than the one you were previously working with. Look for the virtual machine name references.
In this task, you’ll create a detection for the first attack of the previous exercise, a persistence attack.
The following document may help you understand detecting persistent threat attacks.
-
Minimize the RDP session to return to the @lab.VirtualMachine(Windows 11).SelectLink VM.
-
If necessary, open Microsoft Edge, go to the Azure portal, then sign in using these credentials:
Username @lab.CloudPortalCredential(User1).Username Password @lab.CloudPortalCredential(User1).Password If you encounter the Welcome to Microsoft Azure screen, select Get started and then select Skip for the next two screens.
-
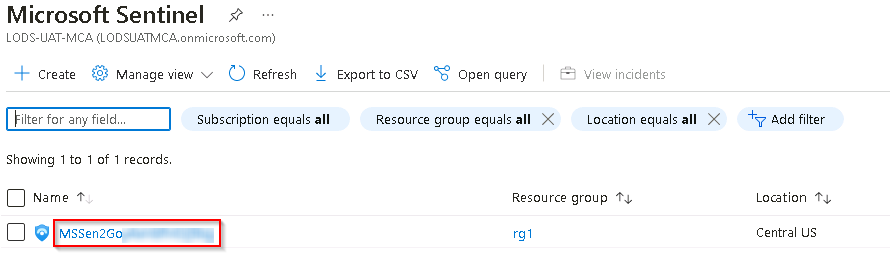
In the search bar of the Azure portal, type Sentinel, then select Microsoft Sentinel from the results.
-
In the list of Microsoft Sentinel Workspaces, select the workspace named MSSen2Go*.
-
On the Microsoft Sentinel pane, under General select Logs.
-
Close the Welcome to Log Analytics window by selecting the associated X icon at the upper right.
-
Close the Queries window by selecting the associated X icon at the upper right.
-
Verify that the SecurityEvent table is being populated with the specific Process event (EventId = 4688) enter the following KQL statement in the query space and select Run.
SecurityEvent
| where Activity startswith "4688"
| where AccountType == "User"
| where CommandLine startswith "REG"
Do not proceed until this query returns valid results. It can take up to 10 minutes for the SecurityEvent table to retrieve the initial event.
-
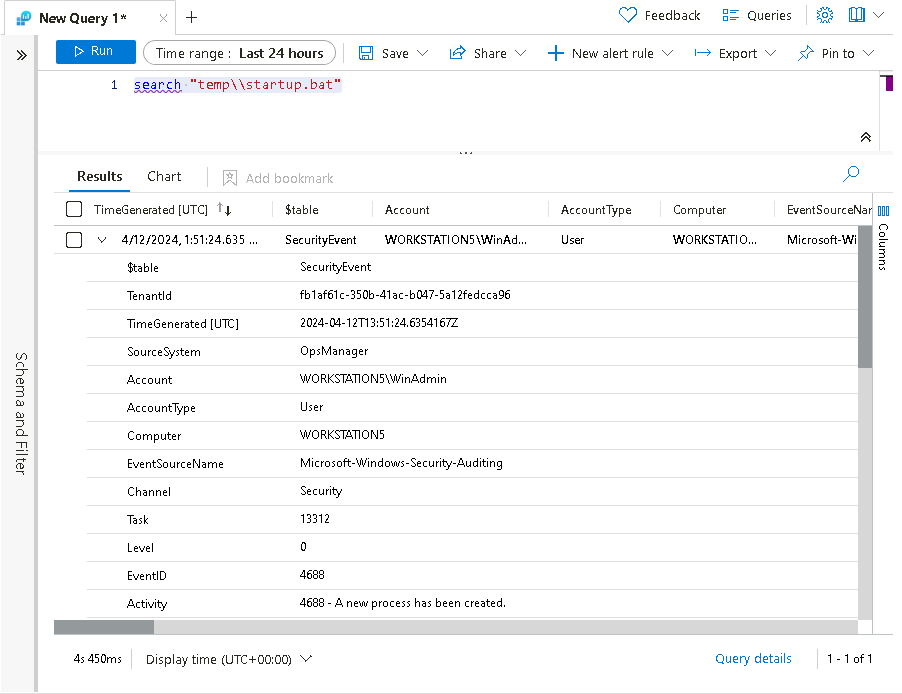
To recall the tables where we have this data, replace the text in the query window with the following KQL statement and select Run.
search "temp\\startup.bat" -
The table SecurityEvent looks to have the data already normalized and easy for us to query. Expand the row to see all the columns related to the record.
-
From the results, we now know that the Threat Actor is using reg.exe to add keys to the Registry key and the program is located in C:\temp. Run the following statement to replace the search operator with the where operator in our query:
SecurityEvent | where Activity startswith "4688" | where Process == "reg.exe" | where CommandLine startswith "REG" -
It’s important to help the Security Operations Center Analyst by providing as much context about the alert as you can. This includes projecting Entities for use in the investigation graph. Run the following query:
SecurityEvent | where Activity startswith "4688" | where Process == "reg.exe" | where CommandLine startswith "REG" | extend timestamp = TimeGenerated, HostCustomEntity = Computer, AccountCustomEntity = SubjectUserName -
Now that you have a good detection rule you can create a new scheduled rule. In the Logs window, select the + New alert rule in the command bar and then select Create Microsoft Sentinel alert.
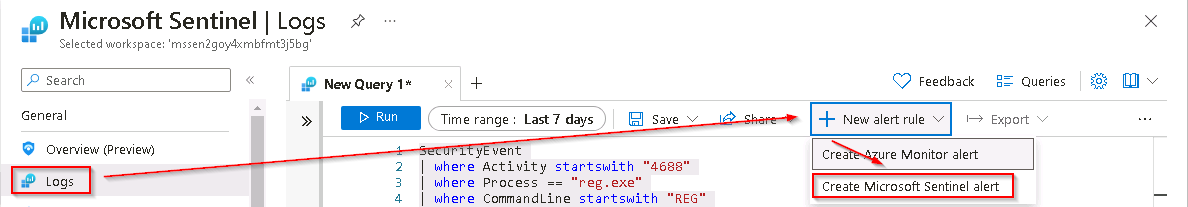
You might need to select the ellipsis (…) button in the command bar.
-
On the Analytics rule wizard, General tab, complete the fields using the following table and then select Next : Set rule logic >:
Setting Value Name Startup RegKey Description Startup RegKey in c:\temp Severity High Tactics Persistence -
On the Set rule logic tab, the Rule query should be populated already with a KQL query. Use the following table to verify the entities under Alert enhancement - Entity mapping.
Entity Identifier Data Field Account FullName AccountCustomEntity Host Hostname HostCustomEntity 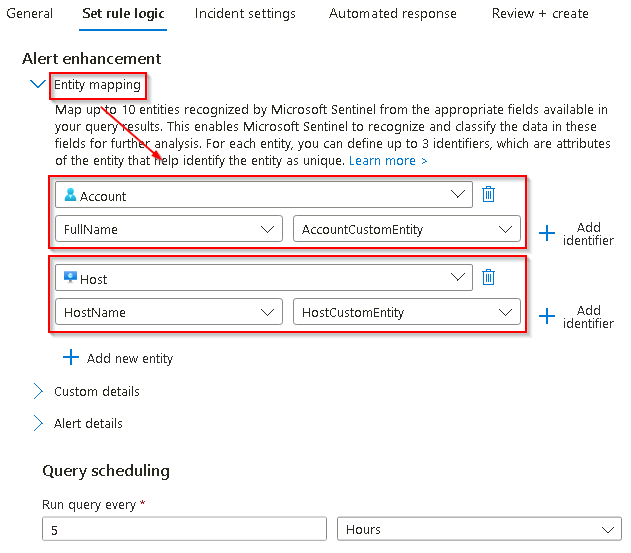
If the values don’t appear in this section, add them from the drop down fields.
-
In the Query scheduling section complete the fields using the following table:
Setting Value Run Query every 5 minutes Lookup data from the last 1 Days 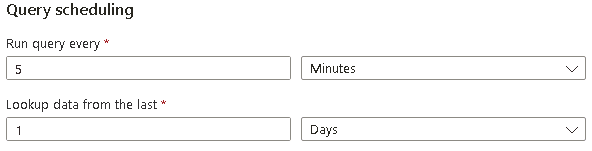
We’re purposely generating many incidents for the same data. This enables the lab to use these alerts.
-
Leave the rest of the options with the defaults values. Select the Next: Incident settings> button.
Do not modify the Start running settings. Changing this to run at a specific time in the future will delay the initial execution of the Sentinel alert. This may be desirable in real-world scenarios but could prevent the successful completion of this lab.
-
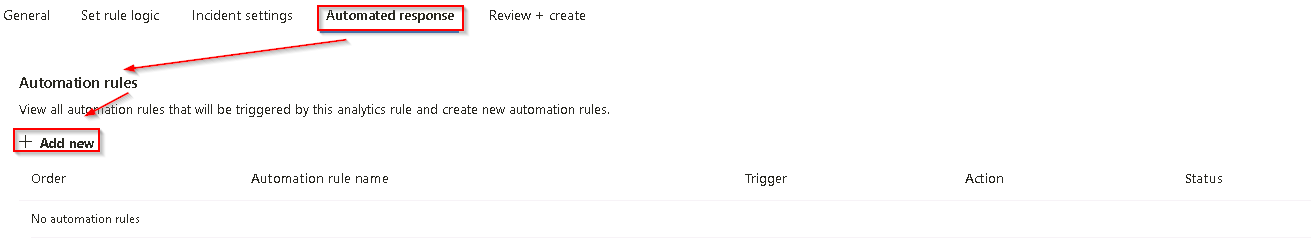
For the Incident settings tab, leave the default values and select the Next: Automated response > button.
-
On the Automated response tab under Automation rules, select Add new.
-
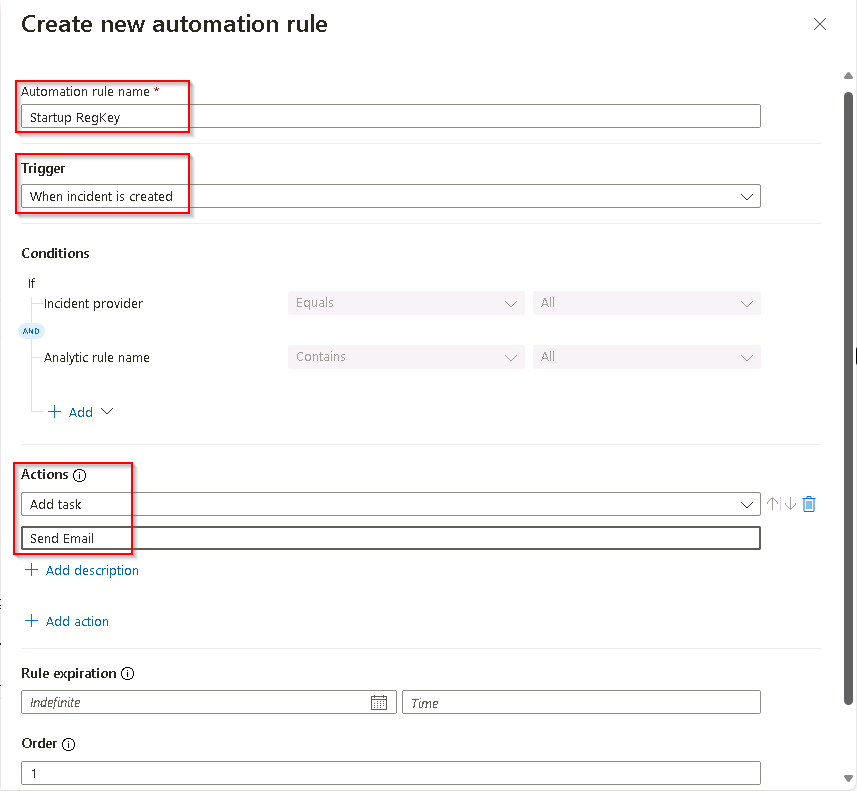
Use the settings in the table to configure the automation rule and select Apply.
Setting Value Automation rule name Startup RegKey Trigger When incident is created Actions Add task Task Title Send Email You can define one or more actions to be run as a result of the trigger including Playbooks which are the preferred action container. Playbooks are efficient and effective modules that can be configured to provide various functions including sending an email notification, shutting down a machine, or any number of security administration actions.
-
On the Automated response tab select the Next: Review + create > button.
-
On the Review + create tab, when the configuration has been validated, select Save to create the new scheduled Analytics rule.