Task 5.1: Explore an incident
In this task, you’ll explore an incident using the Sentinel Incidents blade.
The following document may help you understand incident investigation.
-
If necessary, open Microsoft Edge, go to the Azure Portal, then sign in using these credentials:
Username @lab.CloudPortalCredential(User1).Username Password @lab.CloudPortalCredential(User1).Password If you encounter the Welcome to Microsoft Azure screen, select Get started and then select Skip for the next two screens.
-
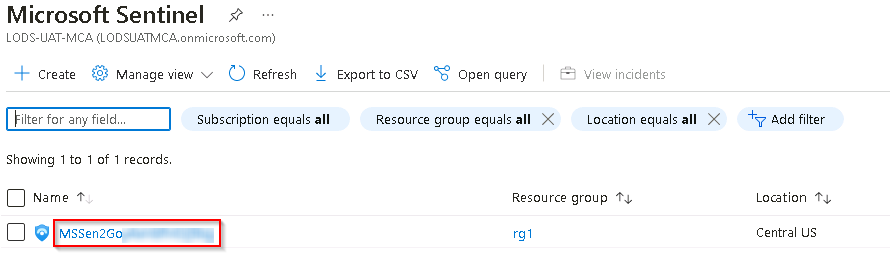
In the Search bar of the Azure portal, type Microsoft Sentinel, then select Microsoft Sentinel.
-
In the list of Microsoft Sentinel Workspaces, select the workspace named MSSen2Go*.
-
In the left menu, under Threat management, select Incidents.
-
Review the list of incidents.
The Analytics rules are generating alerts and incidents on the same specific log entry. Remember that this was done in the Query scheduling configuration to generate more alerts and incidents to be utilized in the lab.
-
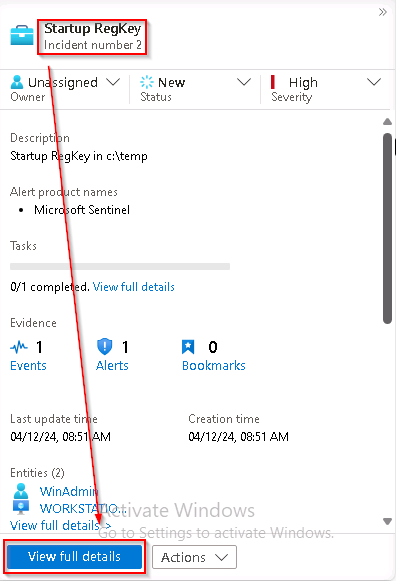
Select one of the Startup RegKey incidents.
-
Review the incident details on the right blade that opened. Scroll down and select the View full details button.
If the “New incident experience” pop-up appears, follow the prompts by reading the information and selecting the Next button.
If you encounter an “Unknown error 0” issue when viewing the full details, perform the following actions before continuing:
- Refresh the Browser by pressing F5 or Ctrl-F5
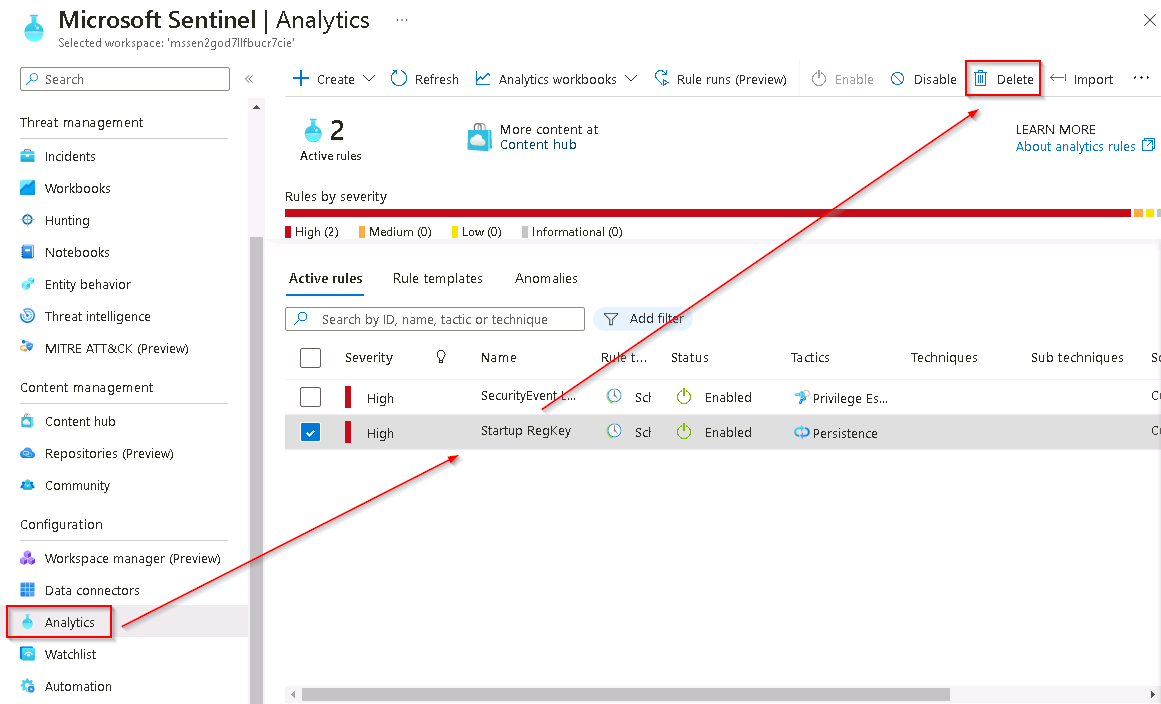
If refreshing the browser doesn’t correct the issue, attempt the following:
- Delete the Startup RegKey rule from the Microsoft Sentinel - Analytics blade
- Recreate the Startup RegKey using the instructions from Exercise 4 Task 1.
-
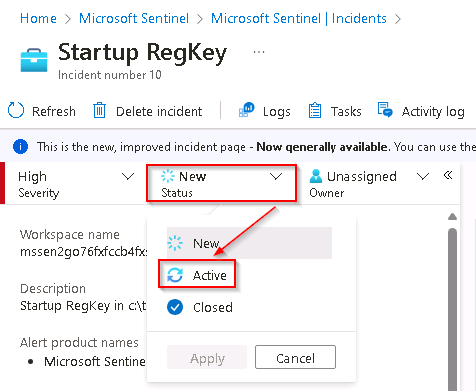
On the left blade of the incident, change the Status to Active.
-
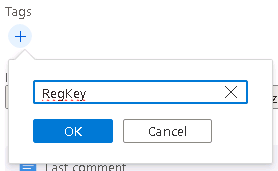
Scroll down to the Tags area, select + and enter RegKey and select OK.
-
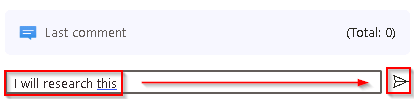
Scroll down and in the Write a comment… box enter I will research this and select the > icon to submit the new comment.
-
Hide the left blade by selecting the « icon next to the owner.

-
Review the Incident timeline window. Select the Incident Actions button at top-right, and then select Run playbook.
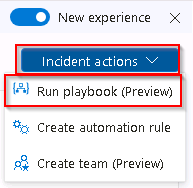
The Run playbook on incident blade allows you to view and select the active playbooks and run them manually. Since you haven’t configured any playbooks as part of this lab you won’t see any listed here.
-
Close the Run playbook on incident blade by selecting the X icon in the upper right.

-
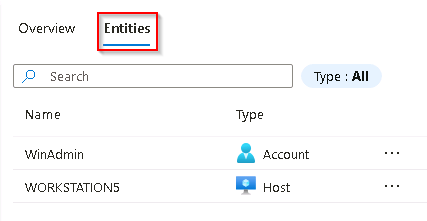
Review the Entities window. At least the Host entity that we mapped within the KQL query from the previous exercise should appear.
If no entities are shown, refresh the page.
-
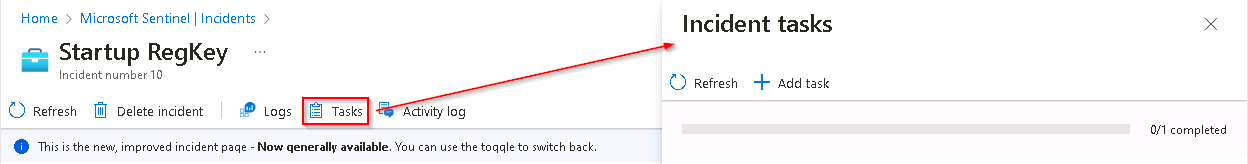
To open the Incident tasks blade select the Tasks button from the command bar.
-
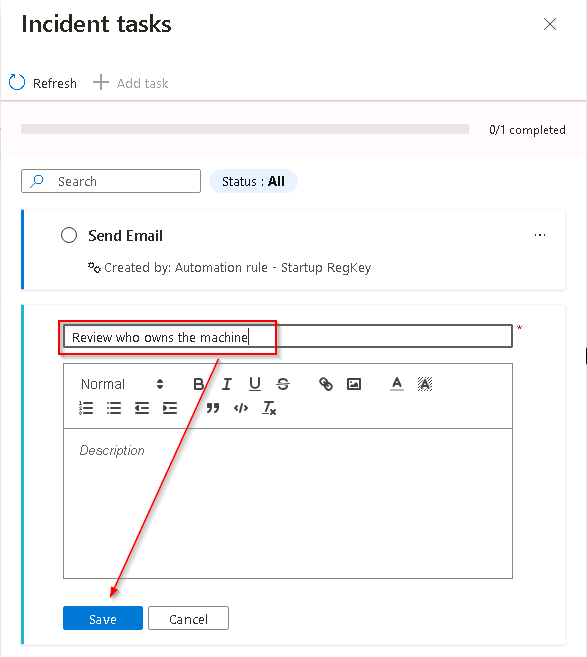
Select + Add task, in the Title box type Review who owns the machine and then select Save.
-
Close the Incident tasks blade by selecting the X icon in the upper right.
-
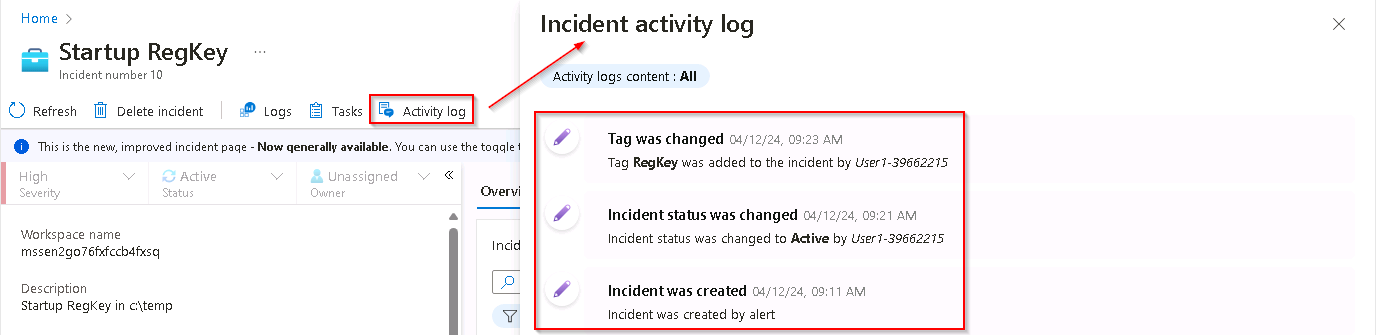
Select the Activity Log button from the command bar and review the actions you’ve taken during this exercise.
-
Close the Incident activity log blade by selecting Close at the lower right.
-
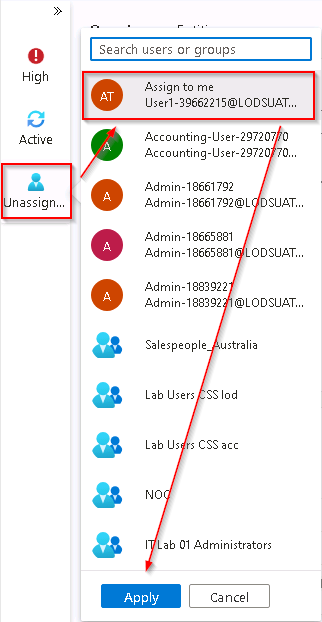
From the almost hidden left blade, select the user icon named Unassigned. The new incident experience allows quick changes from here.
-
Select Assign to me and then scroll down to select Apply to save the changes.