Task 5.2: Investigate an incident
In this task, you will investigate a Sentinel incident using the Investigation blade.
-
Expand the left blade by selecting the » icon. and then, at the bottom, select Investigate.
Hint: If the icons are too small for your screen, select (+) to magnify them.
-
Hover over the WORKSTATION5 entity icon and wait for new exploration queries to be shown. It looks like Related Alerts has more data on it. Select the name of the exploration query Related Alerts to bring them to the investigation graph
-
Hover over the WORKSTATION5 entity icon and wait for new exploration queries to be shown. Hover over any node and then select Events > to investigate it with a KQL query.
-
Close the query window by selecting the X icon at the upper right to go back to the Investigation page.
-
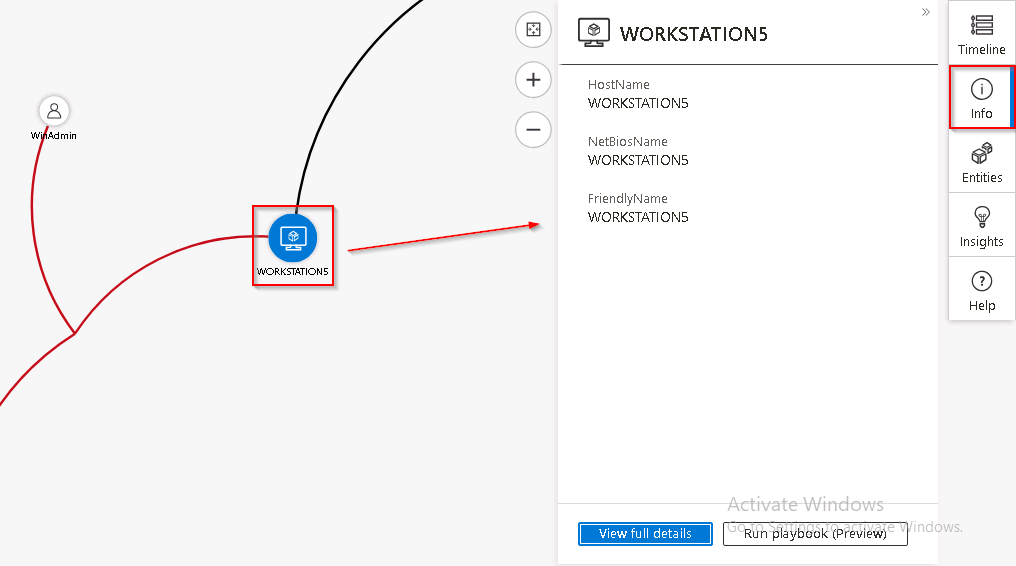
To open a window on the right with more detailed information about the virtual machine nodes select the WORKSTATION5 entity and review the details on the Info page.
-
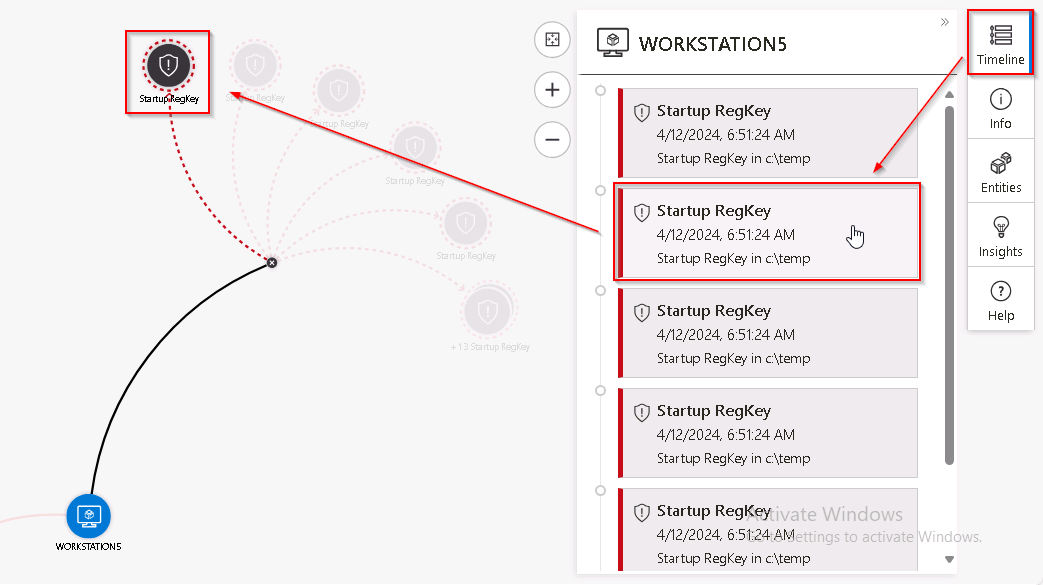
To see which items on the graph occurred at a point in time select the Timeline tab and hover over the incident.
-
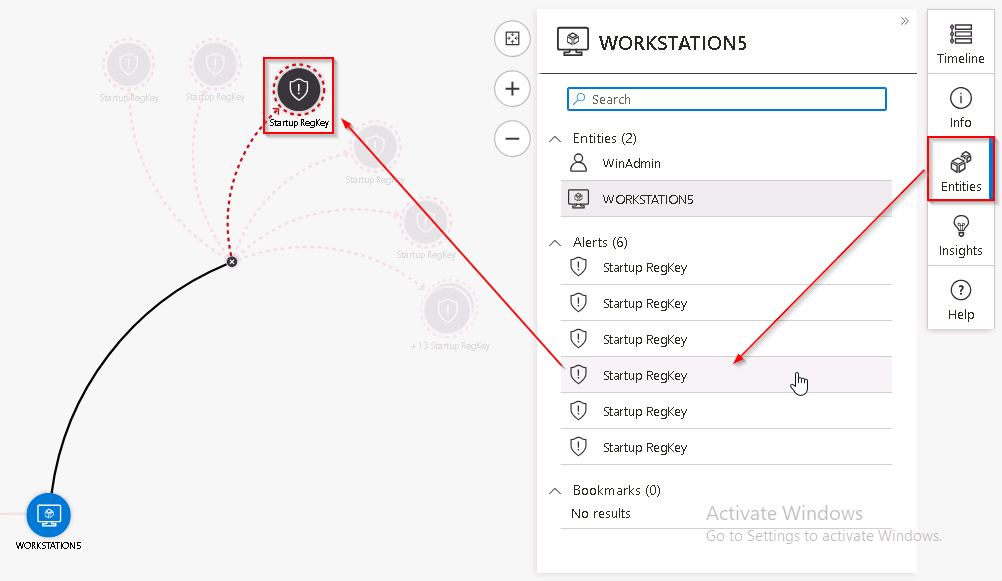
To review the Entities and Alerts related to WORKSTATION5, select the Entities tab and hover over the entity or alert.
-
Close the investigation graph by selecting the X icon at the upper right of the page.
-
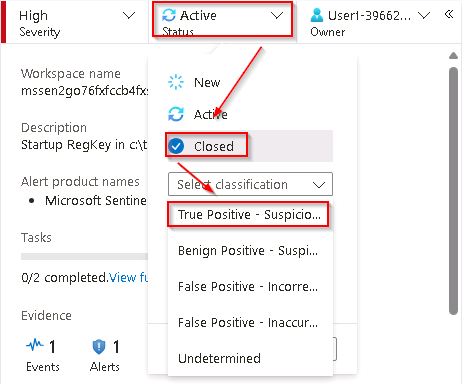
Back on the incident page, in the left pane, select Active Status and select Closed.
-
In the Select classification drop-down menu review the different options. After that, select True positive - suspicious activity and then select Apply.
Congratulations!
You’ve successfully completed the TechExcel: Sentinel onboarding and migration acceleration lab.