TRE API
The TRE API is a service that users can interact with to request changes to workspaces e.g., to create, update, delete workspaces and workspace services inside each workspace.
This page is a guide for a developer looking to make a change to the API and debug it.
Repository folder structure
api_app
├── api              - API implementation
│   ├── dependencies - Dependencies for routes definition
│   ├── errors       - Definitions of error handlers
│   └── routes       - Web routes (API endpoints)
│
├── core             - Application configuration, startup events, logging
│
├── db               - Database related implementation
│   ├── migrations   - Manually written alembic migrations
│   └── repositories - All CRUD features
│
├── models           - Pydantic models for this application
│   ├── domain       - Main models that are used almost everywhere
│   └── schemas      - Schemas for using in web routes
│
├── resources        - Strings that are used e.g., in web responses
│
├── services         - Logic that is not only CRUD related (authentication, logging, tracing, etc)
│
├── tests_ma         - Unit tests
│
└── main.py          - FastAPI application creation and configuration
Unit tests
The unit tests are written with pytest and located in folder /api_app/tests_ma/.
Run all unit tests with the following command in the root folder of the repository:
pytest --ignore=e2e_tests
Please refer to a different guide on running E2E tests locally.
Local debugging
To set up local debugging, first run (if you haven't done so already)
az login
make setup-local-debugging
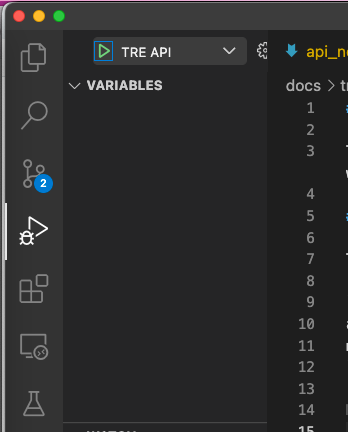
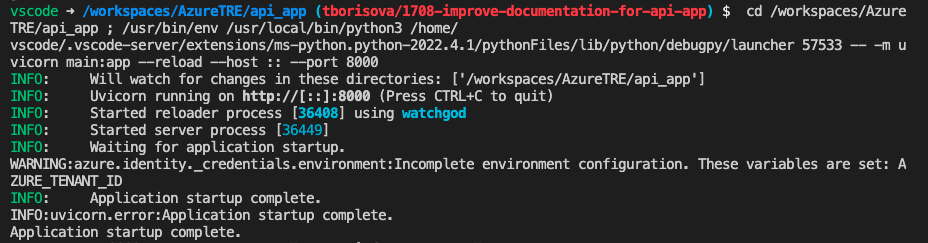
Next, go to "Run and Debug" panel in VSCode, and select TRE API.
You will see a log similar to this:
Now, you should be able to open Swagger UI for your local instance on http://localhost:8000/api/docs.
Cloud instance
On Azure Portal, find an App Service instance named app-${TRE_ID}.
API logs in LogAnalytics
To find logs in LogAnalytics, go to your resource group, then to LogAnalytics instance, which is named like log-${TRE_ID}.
There, you can run a query like
AppTraces
| where AppRoleName == "uvicorn"
| order by TimeGenerated desc
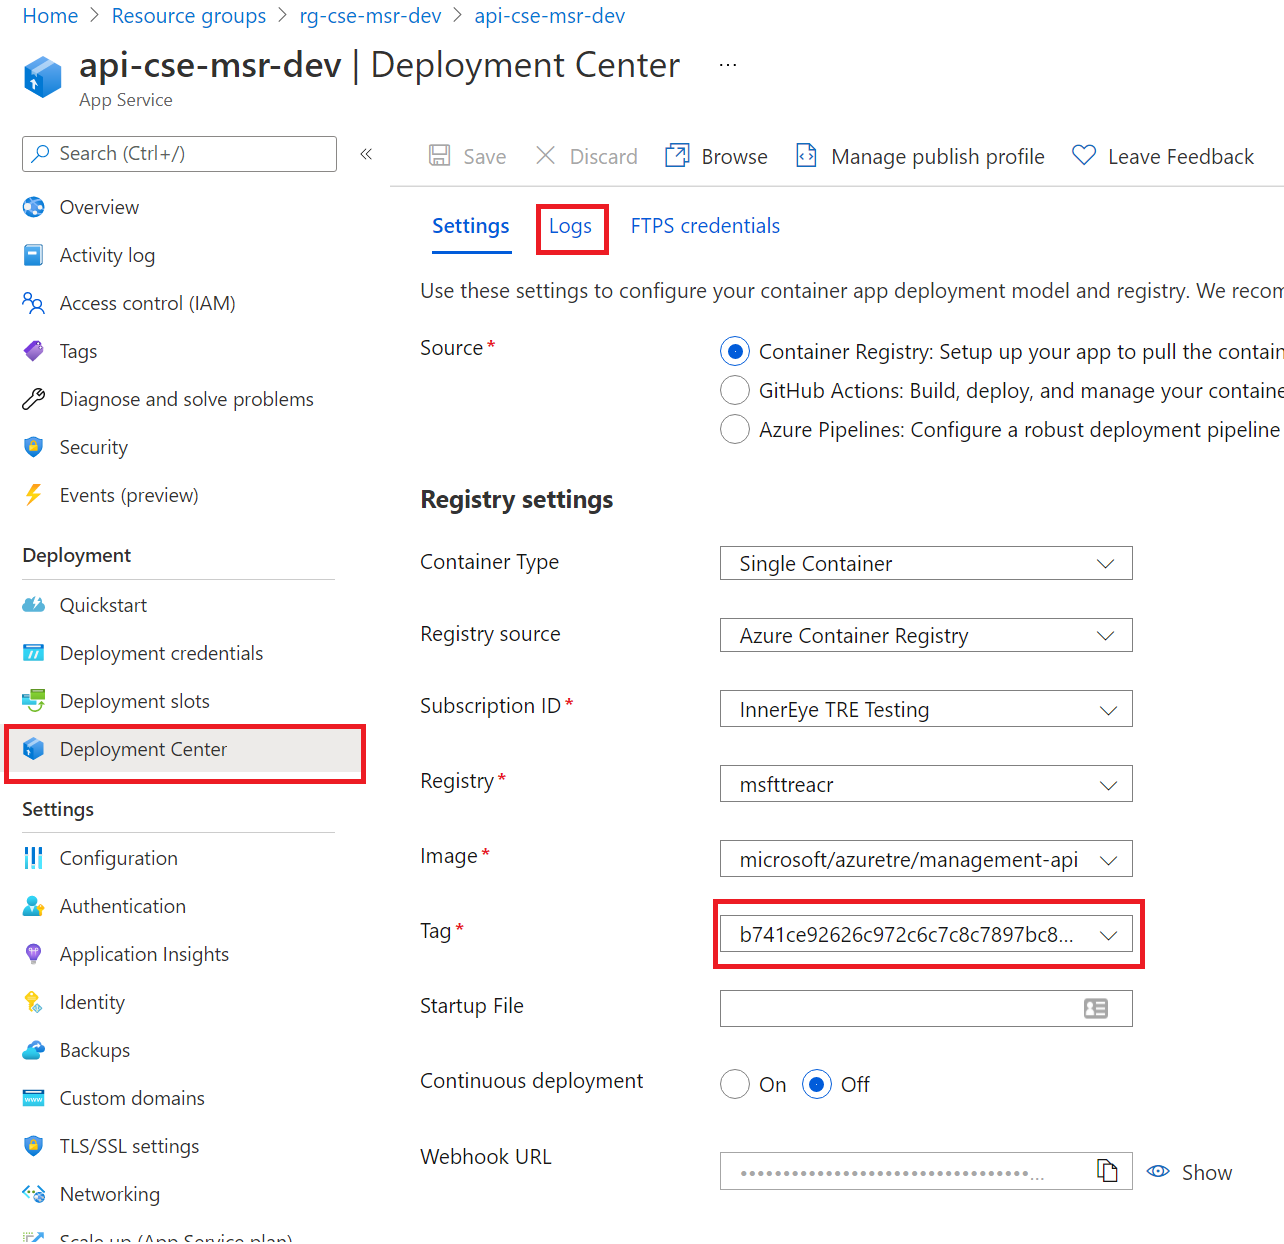
API logs using deployment center
Check that the version you are debugging/troubleshooting is the same one deployed on the App Service.
You can check this in Deployment Center, or follow the logs as generated by the container in the logs tabs.
Deploying a cloud instance
To deploy a new version of the API to your TRE deployment, do this:
-
Update the version in
api_app/_version.py -
Run
make build-and-push-api
make deploy-core
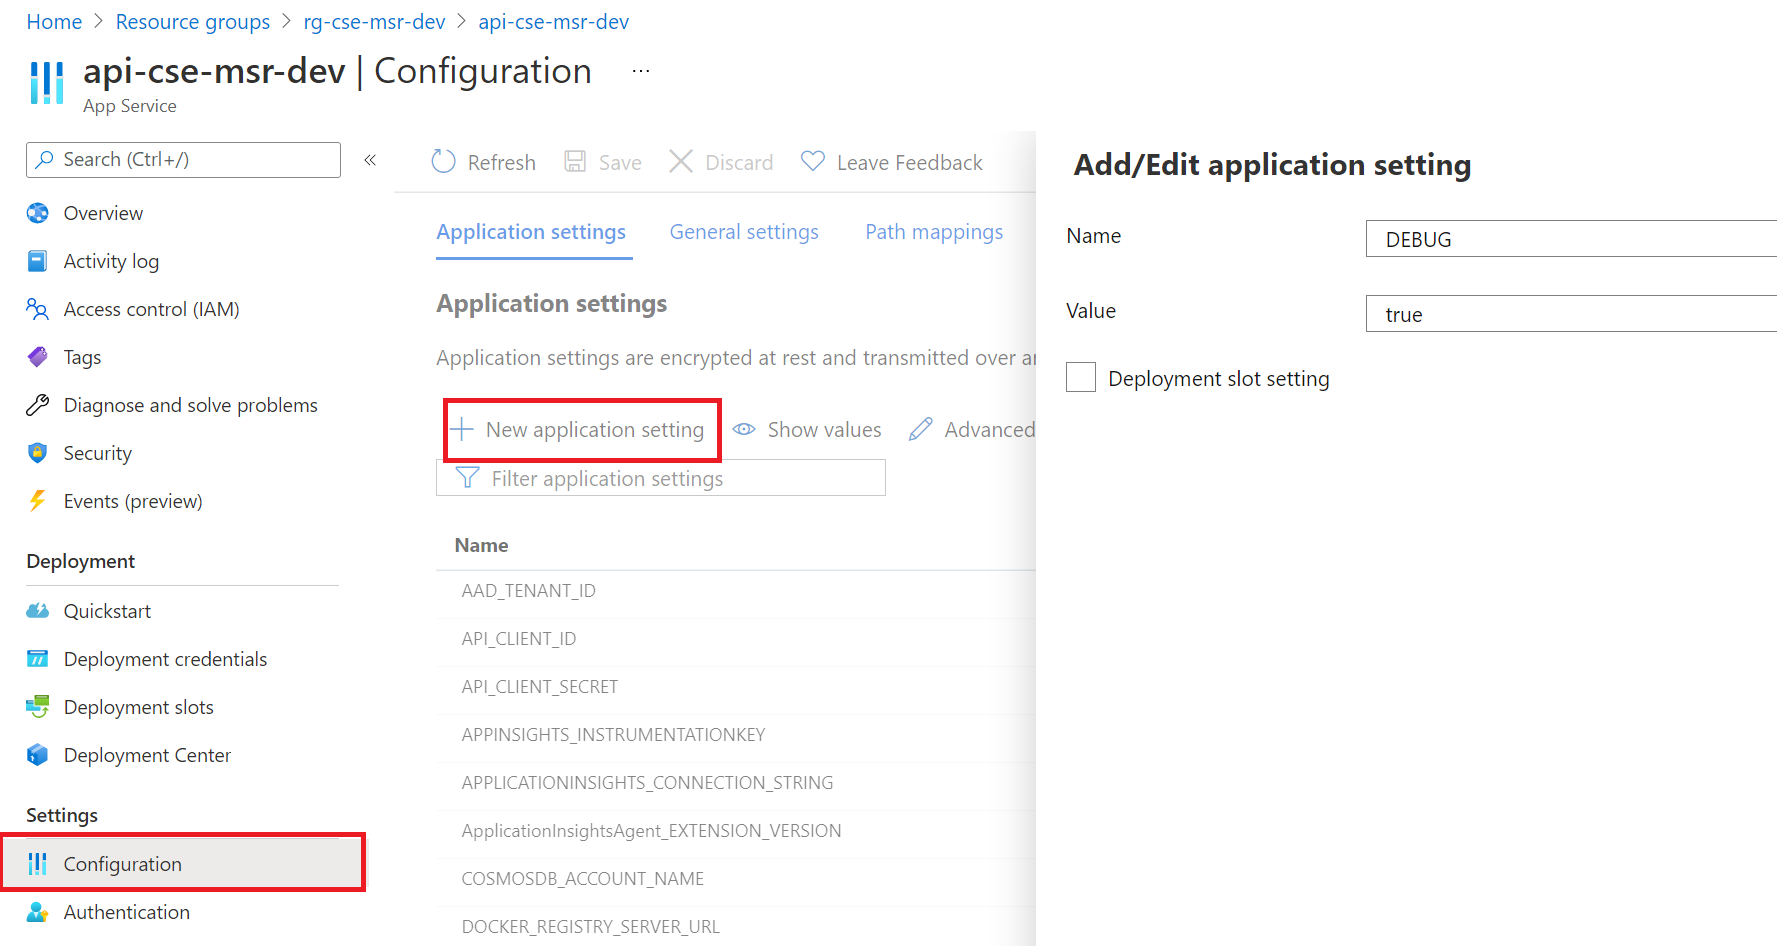
Enabling DEBUG mode on the API
For security, the API is by default configured to not show detailed error messages and stack trace when an error occurs.
You can enable debugging via one of the two ways:
- Set
debug=trueunder developer_settings section in yourconfig.yamlfile (see [])
To enable debugging on an already running instance:
- Go to App Service for the API and select Settings > Configuration.
- Click New Application Setting.
- in the new dialog box set Name=DEBUG and Value=true
Using Swagger UI
Swagger UI lets you send requests to the API.
To send a request, click on the row with the request, then Try out, then Execute. See screenshot:
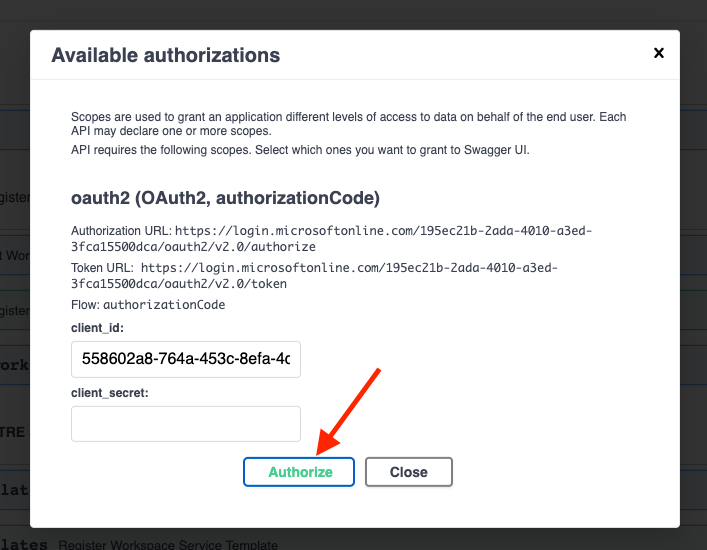
Authorization
Swagger UI is accessible under https://${TRE_ID}.${LOCATION}.cloudapp.azure.com/api/docs.
To start using it, click Authorize button, then click Authorize (leave the field client_secret empty). See screenshot:
If you see an error message saying something like:
The redirect URI 'https://tanyagts8.westeurope.cloudapp.azure.com/api/docs/oauth2-redirect' specified in the request does not match the redirect URIs configured for the application '558602a8-764a-453c-8efa-4dc3ddd61570'.
Then you'll need to update the redirect URI (see below).
Otherwise, after you sign in on Azure Portal, the lock icon on Authorize button should look "locked". Then you can start executing queries.
See also setup instructions.
All workspace operations are executed using a different URL: https://${TRE_ID}.${LOCATION}.cloudapp.azure.com/api/workspaces/${WORKSPACE_ID}/docs. See also instructions on installing base workspace.
Updating the redirect URI
If you get the following error:
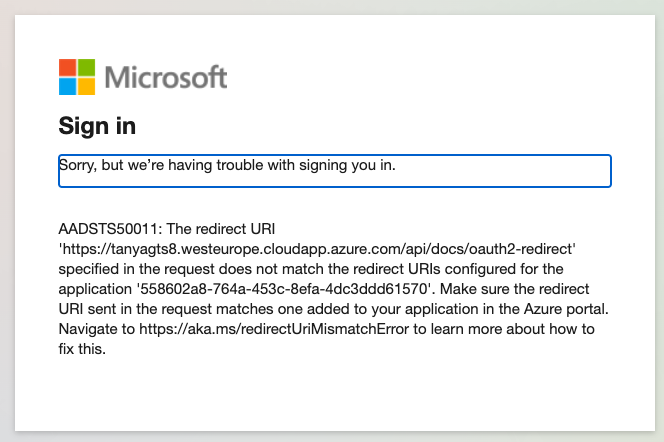
You should run:
make auth
Alternatively, in Azure Portal you can add the redirect URL to the App Registration.
Under AAD, find App Registrations, and find the App Registration with the ID shown in the error message.
There, go to Redirect URL and add the URL given to you by the error message (it will have a form of
https://${TRE_ID}.westeurope.cloudapp.azure.com/api/docs/oauth2-redirect).
Troubleshooting
Wrong docker image version
If this happens, you will see a log similar to this:
2022-05-10T05:34:48.844Z ERROR - DockerApiException: Docker API responded with status code=NotFound, response={"message":"manifest for tborisdevtreacr.azurecr.io/microsoft/azuretre/api:0.2.24 not found: manifest unknown: manifest tagged by \"0.2.24\" is not found"}
To fix, run make build-and-push-api from your branch and restart the instance.
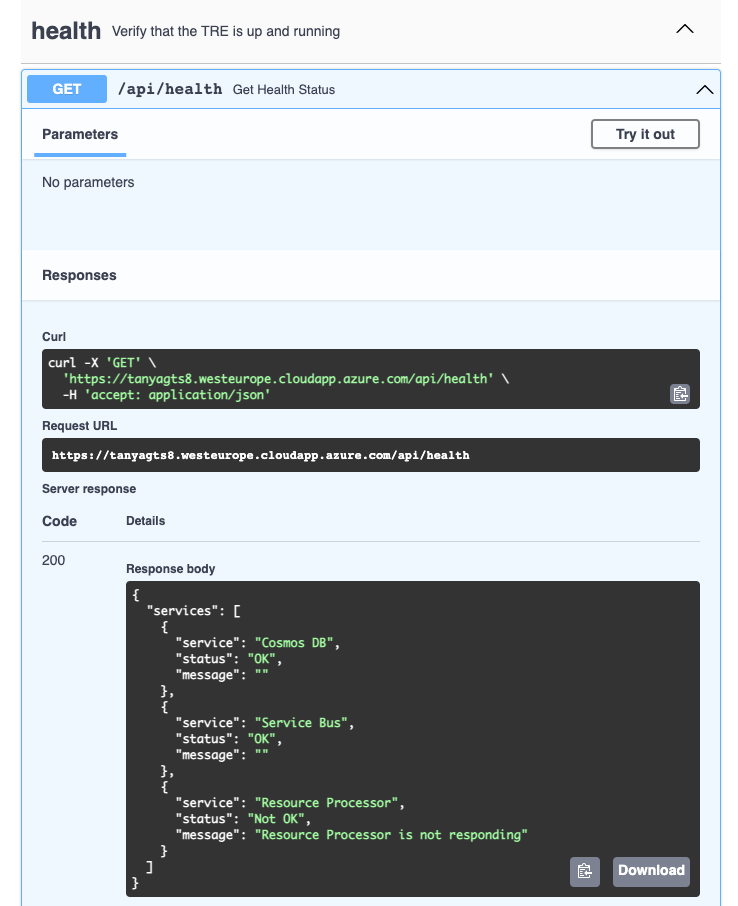
Investigating /api/health response
The endpoint /api/health tracks health of not only API, but other components of the system too, and can help to narrow down any problems with your deployment:
{
  "services": [
    {
      "service": "Cosmos DB",
      "status": "OK",
      "message": ""
    },
    {
      "service": "Service Bus",
      "status": "OK",
      "message": ""
    },
    {
      "service": "Resource Processor",
      "status": "Not OK",
      "message": "Resource Processor is not responding"
    }
  ]
}
In this case, next step is to look at logs of Resource Processor. See also Resource Processor docs.